Quick chart navigation
First, you need to disable chart auto-scrolling.
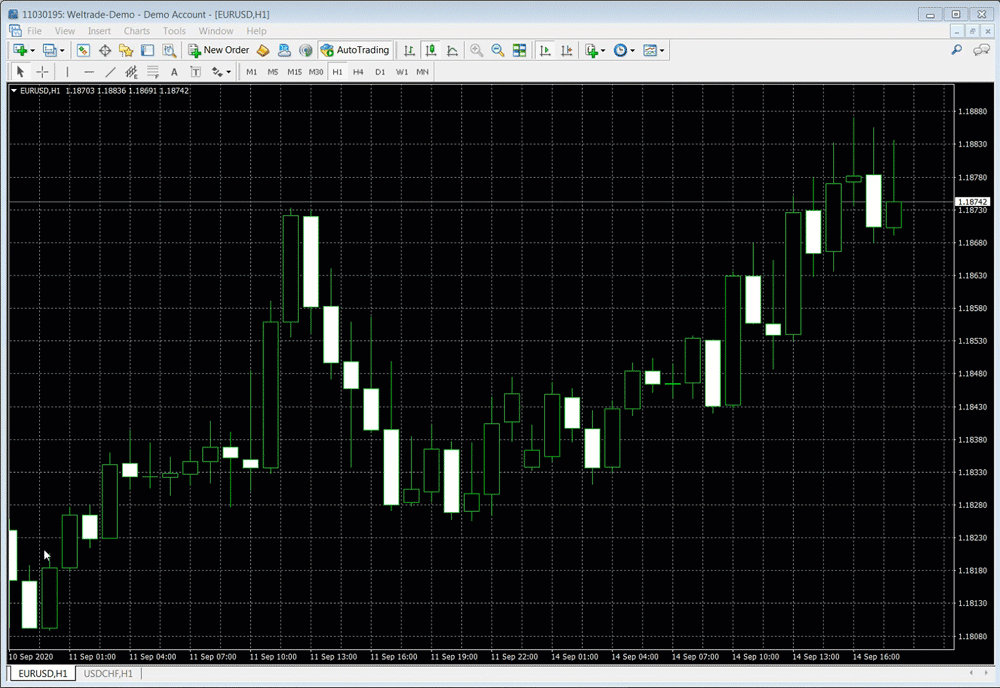
Input formats:
- time (hours:minutes), for example: 15:10
- date, for example: 08/10/2020
- date and time, for example: 08/10/2020 18:30
- symbol, for example: USDJPY
- timeframe, for example: M1
- symbol and timeframe, for example: USDJPY, M1
Press the Enter key to execute the command, Esc to cancel.
Displaying the account history on the chart.
MT4 allows you to display closed positions and deleted pending orders on charts by dragging and dropping them into the chart window from your Account History.
When you drag an order onto another symbol chart, the chart switches to the order symbol.
If you hold down the Shift key while dragging, all positions are displayed next to the order symbol displayed in the Account History.
Graph Ruler
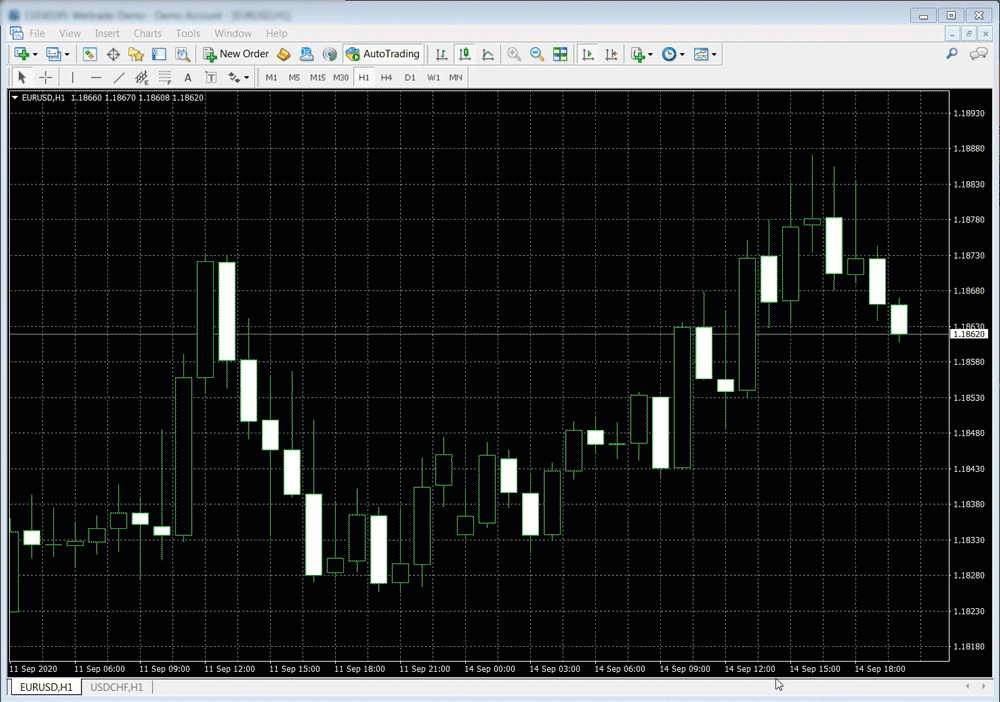
Call "Crosshair" (CTRL + F), select the first point with the left mouse button and, without releasing the button, move the cursor to the second point. The digital indicator next to the cursor will show the number of bars / distance in points / offer price at the location of the cursor.
Tracking the overall status of the account
In MT4, you can track the total exposure, profit-loss and weighted average entry price for all positions using the iExposure custom indicator.
You need to drop iExposure on the chart from the "Custom Indicators" list of the "Navigator" window (CTRL + N).
A table will appear in the graph window, which will display the total exposure for each symbol in real time, for which there are positions.
- Symbol - symbol;
- Deals - the total number of open positions for the symbol;
- Lots to buy - the total volume of positions to buy by symbol;
- Buy price - the weighted average price of opening buy positions;
- Sell Lots - total volume of sell positions by symbol;
- Sell price - the weighted average price of opening sell positions;
- Net Lots - total position for the instrument;
- Profit - total profit-loss on the instrument.
The note:
Changes in current positions are displayed by iExposure with the next tick of the corresponding symbol.
Create your own default templates
The default color scheme for charts and indicators can be changed by creating your own scheme through the Charts-> Properties-> General menu (F8 key) and saving this scheme through the Charts-> Template-> Save template menu, saving this scheme as default. tpl
The saved default.tpl template will be applied to all newly opened charts.
To change the default template for plots opened offline (File->Open Offline), you need to save the template offline.tpl
To change the default template for charts opened with the Strategy Tester (CTRL + R), you need to save the tester.tpl template.
Templates save:
- chart color scheme;
- chart scale, set by the Zoom In \ Zoom Out options;
- chart type (candles, bars, line);
- attached indicators and advisors with their settings;
- presence / absence of an OHLC line;
- time period separators;
- geometric objects (lines, etc.).
View contract specification
The main characteristics of the symbols can be found in the terminal by opening the properties of the symbol (right-click "Market Watch" -> "Symbols" -> select the symbol -> "Properties").
The specification window displays:
- Spread (in points);
- Accuracy (digits after the dot);
- Stop level (in points, this is the minimum distance for placing orders from the current price);
Type of execution of pending orders:
- 1) GTC - valid until cancelled;
- 2) intraday including SL \ TP;
- 3) intraday, excluding SL \ TP;
Contract size (in base units);
Profit calculation method:
1) Forex, CFD = [(close_price - open_price) * contract_size * лоты]
2) Futures = [(close_price - open_price) * tick_price / tick_size * lots]
Exchange type:
- 1) in points;
- 2) in the base currency of the instrument;
- 3) in percentage;
- 4) in the margin calculation currency;
Exchange of long positions;
Exchange of short positions;
Margin Calculation Method:
- Forex = [lots * contract_size / leverage]
- CFD = [lots * contract_size * market_price * leverage]
- Futures = [lots * initial_margin]
Hedged margin (in base units);
Initial margin and maintenance margin (for USD futures).
Frequently used indicators, advisors and scripts
You can add to favorites through the context menu of indicators in the navigator window (CTRL + N).
Download the full history of quotes.
Many traders need a long history of quotes to work with the strategy tester or to export to other analysis programs. To download the full history of quotes, follow these steps:
Increase the maximum number of bars in the chart settings (Tools->Settings->Charts, "Maximum number of bars in history" parameter) on the assumption that one day is equal to 1440 minutes.
Go to Tools -> Quotes Archive (F2), select the instrument of interest, then:
a) select the tool you are interested in by double-clicking the left mouse button, click "Load".
As a result, MetaTrader4 downloads the history of minute quotes from the data archive of the developer MetaQuotes Software Corp * and converts it to all timeframes.
b) select the timeframe you are interested in by double-clicking the timeframe line in the list.
After that, the history for the selected timeframe will be loaded.
*Note: the MetaQuotes quotes archive is the same for all MT4 users, but keep in mind that the quotes history contained in it may not fully correspond to the data of your DC. In addition, the archive may be missing data for some characters quoted by your DC.
Export of graphic designs from one PC to another PC (PDA, smartphone)
It is possible to export graphical structures (levels, trendlines, etc.) from Metatrader installed on one computer to another PC, PDA, smartphone. Since linear objects are saved in templates, it is enough to transfer the saved template tpl file from the MetaTrader4 \ templates directory to a similar directory on another device.
Creating custom timeframes in MT4.
If you are not satisfied with the standard timeframes, you can create your own using the built-in period_converter script.
For example, we need to get a 2-hour chart. Procedure:
Open the navigator (CTRL + N) and drag the period_converter from the "Scenarios" list onto the hourly chart.
Open the "General" properties of the script and check the "Allow import of functions from DLL" box. If you want the DLL to be automatically connected when the schedule is called, uncheck "Manual call confirmation".
Open the "Inputs" of the script and enter the value of the new timeframe in units of the base timeframe, in this case ExtPeriodMultiplier = 2
Click OK. The script creates a new history file, signaling this with a message on the "Experts" tab, for example: 2020.09.13 13:32:14 period_converter USDJPY, H2: 1891 record(s) written
Open menu File > Work Offline, find "USDJPY, H2" in the list, click "Open".
Enjoy the result. The chart will be updated in real time according to the created timeframe.
Notes:
If the "Manual confirmation of the call" checkbox was checked, then the first time the price is updated, a confirmation dialog box will appear - click Yes.
The H1 chart on which the script is running must be active (it can be minimized, but it does not need to be closed).
While the script is running, you cannot change the symbols on either the created custom chart or the hourly chart on which the script is running. To create non-standard timeframes for several symbols, you need to open the base chart of each of them and repeat the procedure.
To create the longest history, create custom timeframes from the nearest smaller standard timeframe (e.g. 10M from 5M, 12H from 4H).
Hotkeys
- Pause Break - stop and start the strategy tester
- CTRL + Z - cancel deleting the object from the chart;
- CTRL + F - call the object "Crosshair";
- F12 - scroll forward histogram.
- F11 - exit to full screen mode;
- F10 - call the quotes window; using the "Always on top" command in the context menu. This window is docked on top of all windows, allowing you to keep track of quotes while working in others when Ctrl + F (or middle mouse button) turns on the crosshair
- Ctrl + G enable / disable the grid on the chart
- Ctrl + H enable/disable OHLC data in the top left corner of the graph
- Ctrl + L show/hide volumes
- Ctrl + E enable/disable the Expert Advisor attached to the chart
- Ctrl + Y enable/disable period separators
- Ctrl + F6 go to the next chart window
- Ctrl + P print graph
- Ctrl + S save the current chart in CSV format
- Ctrl + W or Ctrl + F4 close the chart window
- Alt + 1 change chart display as columns
- Alt + 2 change the display of the chart as candles
- Alt + 3 changes the display of the graph on attached lines.
- Opening a window/panel:
- Ctrl + Open a window with installed indicators
- Ctrl + D open/close "Data Window"
- Ctrl + M open/close Market Watch window
- Ctrl + N open/close Navigator window
- Ctrl + O to open the "Settings" window
- Ctrl + R open/close "Tester" window
- Ctrl + T open/close the "Terminal" window
- Ctrl + U to open the "Symbols" window
- Alt + F4 quick exit from the MT4 terminal
- Alt + W open chart control window
- Objects and indicators of the MT4 chart:
- Ctrl + B open the "List of Objects" window
- Delete delete the selected object (one or more)
- Backspace removes the last object added to the chart
- Ctrl + Z or Alt + Backspace undo last delete
- Ctrl + A sets the height of all indicator windows by default (opens in a separate window)
Trading robots 🤖
Scalper ICE CUBE MT4 - https://www.mql5.com/en/market/product/77108
Scalper ICE CUBE MT5 - https://www.mql5.com/en/market/product/77697
Scalper Green Line - https://www.mql5.com/en/market/product/87869
Scalper Golden Gate -https://www.mql5.com/en/market/product/87986
EA Impuls Pro MT4- https://www.mql5.com/en/market/product/72402
EA Impuls Pro MT5 - https://www.mql5.com/en/market/product/72335
EA Pump and Dump MT4 - https://www.mql5.com/en/market/product/73165
EA Pump and Dump MT5 - https://www.mql5.com/en/market/product/72403?
LTS MT4 - https://www.mql5.com/en/market/product/73610
LTS MT5 - https://www.mql5.com/en/market/product/73610
Utility ⚒
EasyTradePad MT4 - https://www.mql5.com/en/market/product/72256
EasyTradePad MT5 - https://www.mql5.com/en/market/product/72454
Risk manager MT4 - https://www.mql5.com/en/market/product/72214
Risk manager MT5 - https://www.mql5.com/en/market/product/72414
Market Screener MT4 - https://www.mql5.com/en/market/product/72380
Market Screener MT5 - https://www.mql5.com/en/market/product/72400
Indicators 📈
3 in 1 Indicator iPump MT4 - https://www.mql5.com/en/market/product/72257
3 in 1 Indicator iPump MT5 - https://www.mql5.com/en/market/product/72442
Power Reserve MT4- https://www.mql5.com/en/market/product/72392
Power Reserve MT5 - https://www.mql5.com/en/market/product/72410
This is just a shortlist of really high-quality products that will improve your trading. Almost all products have MT4 and MT5 version/
A complete list of products was created by me by the link in the profile - https://mql5.com/en/users/batudaev/seller#products
Some words about me
I have a master's degree in finance
I have been trading in financial markets since 2014, and in 2018 I have been developing applications and utilities that I myself use in my trading.
📺 Subscribe to my YouTube - https://www.youtube.com/c/SoftimoTradeEN?sub_confirmation=1
👉 Telegram channel https://t.me/SoftimoTrade_EN



![[$9,496] in 5 Days Using 'Supply Demand EA ProBot' (Live Results) [$9,496] in 5 Days Using 'Supply Demand EA ProBot' (Live Results)](https://c.mql5.com/6/965/splash-preview-761070-1740062258.png)