All in One Candlestick Pattern Scanner, Multi Timeframe and Multi Symbol
Product Page MT5: click here
Product Page MT4: click here
You can download the demo versions from bottom of the page.
INPUT PARAMETERS:
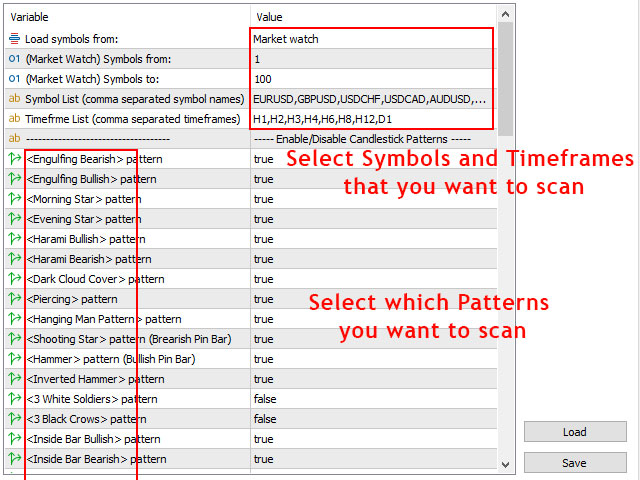
- Load Symbols from: Select the source of the symbols for load into the dashboard, it can be market watch or comma separated symbol names from the next parameter.
- (Market Watch) Symbols from: Start loading market watch symbols from this number.
- (Market Watch) Symbols to: End loading market watch symbols to this number.
- Symbol List: Comma separated list of symbol names to show in the dashboard, ignore this parameter if you select market watch as source of symbols.
- Timefrme List: Input comma separated list of timeframes for showing in dashboard, like: M1,M15,H4,D1.
- Detect trend direction with: You can choose to loosen the rules for detecting the trend direction, this way the scanner detects more patterns, although the additional patterns may not be in the direction of the trend.
- Filter patterns by Moving Average indicator: Set to true to use Moving Average indicator for detecting trend direction and finding candlestick patterns that are in the direction of the trend (check out related parameters in the "Moving Average Filter Settings" section).
Enable/Disable Candlestick Patterns:
There are a lot of strategies for using different candlestick patterns in trading that you can find them with a bit of googling, here I just explain how patterns are recognized by the scanner.
- <Engulfing Bearish> pattern: This pattern consists of a bullish candle (with a body bigger than half of its height) followed by a large bearish candle that closes below the open of the bullish candle. (If you set the "Forex Mode" parameter to false, then close of the first candle must be lower than open of the second candle).
- <Engulfing Bullish> pattern: This pattern consists of a bearish candle (with a body bigger than half of its height) followed by a large bullish candle that closes above the open of the bearish candle. (If you set the "Forex Mode" parameter to false, then close of the first candle must be higher than open of the second candle).
- <Morning Star> pattern: (bullish) This pattern made up of a bearish candle, then a candle with a body smaller than half of the first candle, and a third bullish candle that closes above the middle of first candle. (If you set the "Forex Mode" parameter to false, then close of the first candle must be higher than open of the second candle).
- <Evening Star> pattern: (bearish) The opposite of the morning star, this pattern made up of a bullish candle, then a candle with a body smaller than half of the first candle, and a third bearish candle that closes below the middle of the first candle. (If you set the "Forex Mode" parameter to false, then close of the first candle must be lower than open of the second candle).
- <Harami Bullish> pattern: It consists of a bearish candle followed by a bullish candle with smaller body (and height) that is enclosed within the body (and height)of the prior candle. (If you set the "Forex Mode" parameter to false, then the close of the first candle must be higher than the high of the second candle and the open of the first candle must be lower than the low of the second candle).
- <Harami Bearish> pattern: It consists of a bullish candle followed by a bearish candle with smaller body (and height) that is enclosed within the body (and height)of the prior candle. (If you set the "Forex Mode" parameter to false, then the close of the first candle must be lower than the low of the second candle and the open of the first candle must be higher than the high of the second candle).
- <Dark Cloud Cover> pattern: (bearish) The pattern is composed of a bearish candle that opens above and then closes below the middle of the body of the prior bullish candle (and the lower shadow of the bearish candle is smaller than its body).(If you set the "Forex Mode" parameter to false, then high of the first candle must be lower than open of the second candle).
- <Piercing> pattern: (bullish) This pattern is opposite of the dark cloud cover pattern and composed of a bullish candle that opens below and then closes above the middle of the body of the prior bearish candle (and the upper shadow of the bullish candle is smaller than its body). (If you set the "Forex Mode" parameter to false, then low of the first candle must be higher than open of the second candle).
- <Hanging Man> pattern: (bearish) It has a long lower shadow and a short body at the top of the candle (and the high of the candle is higher than high of the previous candle), you can set the shadow parameters in following parameters. (If you set the "Forex Mode" parameter to false, then the open of the first candle must be lower than the open of the second candle and the close of the first candle must be lower than the close of the second candle).
- <Shooting Star> pattern (Bearish Pin Bar): It has a long upper shadow and a short body at the bottom of the candle (and the high of the candle is higher than high of the previous candle), you can set the shadow parameters in following parameters.
- <Hammer> pattern (Bullish Pin Bar): Like hanging man, it has a long lower shadow and a short body at the top of the candle (but the low of the candle is lower than low of the previous candle), you can set the shadow parameters in following parameters. (If you set the "Forex Mode" parameter to false, then the open of the first candle must be higher than the open of the second candle and the close of the first candle must be higher than the close of the second candle).
- <Inverted Hammer> pattern: (bullish) Like shooting star, it has a long upper shadow and a short body at the bottom of the candle (but the low of the candle is lower than low of the previous candle), you can set the shadow parameters in following parameters.
- <Dragonfly Doji> pattern: (bullish) This pattern has a long lower shadow and equal open and close prices. Also, you can choose if it can have a small nose on top of it or not.
- <Gravestone Doji> pattern: This pattern has a long upper shadow and equal open and close prices. Also, you can choose if it can have a small nose in the bottom of it or not.
- <3 White Soldiers> pattern: (bullish) he pattern consists of three consecutive bullish candles that the body of each candle is bigger than the height of that candle.
- <3 Black Crows> pattern: (bearish) The pattern consists of three consecutive bearish candles that the body of each candle is bigger than the height of that candle.
- <Inside Bar> pattern: (neutral) In this pattern, the second (inside) bar's high price is lower than the previous bar's high and its low price is higher than the previous bar's low.
- <Double Inside Bar> pattern: (neutral) In this pattern, there are two consecutive candle (inside bars) which their high and low failed to break the high and low of the previous bar.
- <Outside Bar> pattern: (neutral) In this pattern a small candle precedes a large one (outside bar) that its high is higher than the previous bar's high and its low is lower than the previous bar's low.
- <Doji> pattern: Open price and close price of the candle are equal (you can set the maximum distance between equal prices (open and close prices)in the following parameter).
- <Evening Doji Star> pattern: (bearish) It is similar to the evening star. The only difference is that in this pattern the second candle is a doji candle that its high is higher than the high of the first and third candles. You can set the maximum distance between doji's open and close prices in the following parameter. (If you set the "Forex Mode" parameter to false, then the close of the first candle and the open of the third candle must be lower than the open of the second candle).
- <Morning Doji Star> pattern: (bullish) It is similar to the morning star. The only difference is that in this pattern the second candle is a doji candle that its low is lower than the low of the first and third candles. You can set the maximum distance between doji's open and close prices in the following parameter. (If you set the "Forex Mode" parameter to false, then the close of the first candle and the open of the third candle must be higher than the open of the second candle).
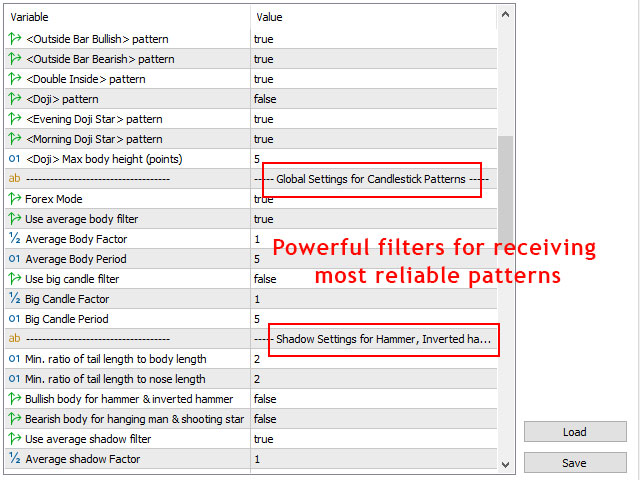
Pattern Specific Settings:
- (Doji) Max body height (points): If you set this parameter=0, then doji patterns must have equal open and close prices, but if you for example set the parameter=5 then open and close prices can be up to 5 points different.
- (Doji) Apply shadow filters (long-legged Doji): Set to true to apply shadow filters on the upper and lower shadows of the Doji patterns, so by enabling this parameter, scanner alerts only for Long-Legged Doji patterns.
- (Dragonfly & Gravestone Doji) Max nose/tail ratio: Maximum value of nose/tail ratio of the candle. Set it to zero if you want the high price of dragonfly pattern or the low price of gravestone pattern to be equal to open and close prices.
- (Engulfing) Alert only extended patterns: Receive alert for engulfing patterns only if the high/low of the second candle exceeds the high/low of the first candle.
- (Morning & Evening Star) Alert only extended patterns: By enabling this option close price of the third candle must exceed the high or low prices of the first candle.
- (Morning & Evening Doji Star) Alert only extended patterns: By enabling this option close price of the third candle must exceed the high or low prices of the first candle.
- (Inside & Dbl Inside Bar) 1st candle body > inside candle body: The body of the first candle must be bigger than the body of the inside candle(s) without considering the direction of the candles.
- (OutsideBar) 2nd candle body > 1st candle body: The body of the poutside candle must be bigger than the body of the first candle without considering the direction of the candles. This is a neutral pattern, if you want to use it as a reversal pattern, use engulfing pattern (extended mode) instead.
- (Harami) Alert on Breakout: By enabling these option, you receive alert for the patterns after price returns and closes above bullish or below bearish patterns.
- (Piercing & Dark Cloud) Alert on Breakout: By enabling these option, you receive alert for the patterns after price returns and closes above Piercing or below Dark Cloud patterns.
- (Hangman & Inverted Hammer) Alert on Breakout: By enabling these option, you receive alert for the patterns after price returns and closes above bullish or below bearish patterns.
- (Inside & Dbl Inside Bar) Alert on Breakout: By enabling these option, you receive alert for the patterns after price returns and closes above bullish or below bearish patterns.
- Breakout must happen before max X candles: Pattern breakout should happen at most X candles after the patterns are formed.
Global Settings for Candlestick Patterns:
- Forex Mode: Some patterns need a gap between candles and this doesn't happen much in forex charts, enable this parameter to ignore the need for gaps in patterns. You can set this parameter to false if you want to use this scanner on markets other than forex.
- Use average body filter: If set to true, the body (difference between close and open) of the first candle of the pattern must be bigger than the average body of previous candles (check two following parameters).
- Average Body Factor: How much body of the first candle of the pattern must be bigger than average of previous candles. For example, if you set this parameter=1.2, then candle must be at least 1.2 times bigger than average of previous candles. If this parameter=1 then this candle must be just bigger than average of previous candles.
- Average Body Period: Number of previous candles that must be use for averaging.
- Use big candle filter: If set to true, body (difference between close and open) of the first candle of the pattern must be bigger than the body of all previous candles (check the two following parameters).
- Big Candle Factor: How many times first candle of the pattern must be bigger than previous candles.
- Big Candle Period: Number of previous candles that the first candle of the pattern must be bigger than them.
Shadow Settings for Hammer, Inverted hammer, Hanging man, Shooting star:
- Min. ratio of tail length to body length: How many times the main shadow (tail) of the candle must be bigger than the body of the candle. For example, if you set this parameter=1.2, then main shadow must be at least 1.2 times bigger than the body of candle. If this parameter=1 then main shadow must be just bigger than body of the candle.
- Min. ratio of tail length to nose length: How many times the main shadow (tail) of the candle must be bigger than the small shadow (nose) of the candle. For example, if you set this parameter=1.2, then main shadow must be at least 1.2 times bigger than the small shadow of candle. If this parameter=1 then main shadow must be just bigger than the small shadow.
- Bullish body for hammer & inverted hammer: If set to true, body of the hammer & inverted hammer candles must be bullish.
- Bullish body for hanging man & shooting star: If set to true, body of the hanging man & shooting star candles must be bullish.
- Use average shadow filter: If set to true, tail of the candle of the pattern must be bigger than the average body size of the previous candles (check the two following parameters).
- Average shadow Factor: How much of the tail of the candle in the pattern must be bigger than the average body size of the previous candles.
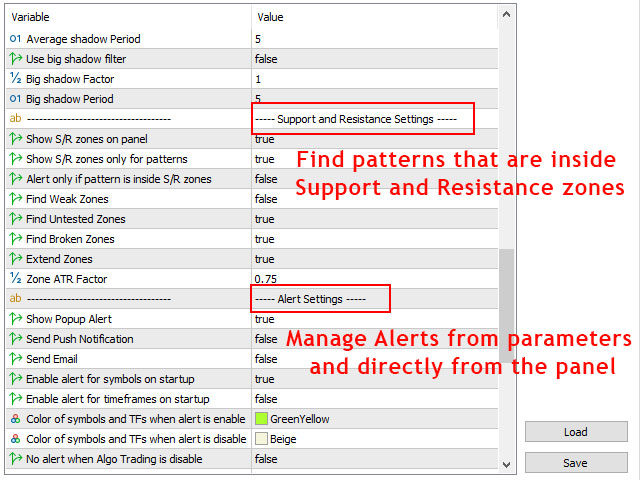
- Average shadow Period: Number of previous candles that must be use for averaging.
- Use big shadow filter: If set to true, the tail of the pattern's candle must be bigger than body of all previous candles (check the two following parameters)
- Big shadow Factor: How many times the tail of pattern's candle must be bigger than previous candles.
- Big shadow Period: Number of previous candles that the tail of pattern's candle must be bigger than them.
Moving Average Filter Settings:
- Which MA filter to use: You can filter bullish and bearish patterns based on the one MA indicator, 2 MA cross or applying both of them on the patterns.
- Which single MA filter to use: You can use the direction of the main MA or the position of the price related to the main MA (or both of them) to filter the patterns based on the single MA indicator filter.
- Main MA Period: Main MA Period
- Main MA Method: Main MA Method
- Main MA Applied price: Main MA applied price
- Second MA Period: Second MA period
- Second MA Method: Second MA method
- Second MA Applied price: Second MA applied price
Support and Resistance Settings:
Support and resistance zones are calculated based on shved supply and demand indicator that you can download for free from this link (Dashboard doesn't need the indicator to run).- Show S/R zones on dashboard: if set to true, scanner checks all timeframes of all symbols, and if symbols price or candlestick patterns are inside support or resistance zones then it changes the background color of the related cell based on the type of the zone. Also if you move the mouse cursor to the cell you can see the strength of the zone on the popup text.
- Alert only if pattern is inside S/R zones: If set to true, the alert only triggers if candlestick pattern is formed inside the support and resistance zones.
- Find Weak Zones If set to false, weak zones won't show in dashboard and alert won't trigger for them.
- Find Untested Zones: If set to false, untested zones won't show in dashboard and alert won't trigger for them.
- Find Broken Zones: If set to false, broken zones won't show in dashboard and alert won't trigger for them.
- Extend Zones: if set to true, EA goes dipper in history bars to find support and resistance zones. The result will be more and sometimes wider zones.
- Ignore Near Weak & Wide Zones: If set to true, EA ignores the weak and broken zones that their distance to next stronger zone is less than their width.
- Zone ATR Factor: Changes zone height based on ATR indicator values, less value means thinner and more accurate zones, but less chance to trigger the alert.
Alert Settings:
- Enable alert for symbols on startup: Select to enable which type of alerts (bullish, bearish, both, none) for symbols when attaching the dashboard to chart. Also you can set the dashboard to load alert status from last session. So you can change the alert types for symbols based on the trend direction and it won't change next time that you run the dashboard, this way it acts as a trend direction reminder for you. You can also change the alert type for each symbol by clicking on its cell on the dashboard.
- Enable alert for these timeframes on startup: Comma separated list of timeframes to enable alert for them when attaching the dashboard to chart. You can also enable/disable alert for each symbol by clicking on its cell on the dashboard.
- Show Alert: Show popup alert when the selected patterns appear in the selected timeframes of the selected symbols.
- Send Push Notification: Send push notification to mobile phone when dashboard alert triggers (you should set metatrader Notifications options).
- Send Email: Send email when dashboard alert triggers (you should set metatrader Email options).
- Color of TF cells when alert is enable: Color for timeframe cells when alert is enabled.
- Color of symbol and TF cells when alert is disable: Color for symbol and timeframe cells when alert is disabled.
- Color of symbol cell when bullish & bearish alerts enabled: Color for symbol cells when bullish & bearish alerts are enabled.
- Color of symbol cell when bullish alert enabled: Color for symbol cells when only bullish alert is enabled.
- Color of symbol cell when bearish alert enabled: Color for symbol cells when only bearish alert is enabled.
- No alert when Algo Trading is disable: If true, then you can disable alerts by disabling "Algo trading" button on metatrader terminal.
Dashboard Settings:
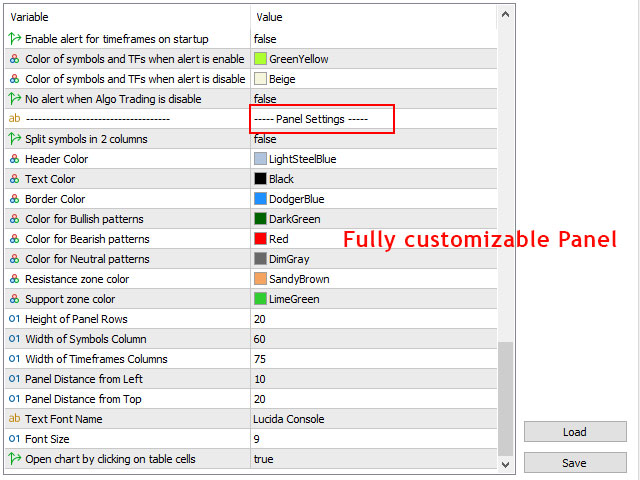
- Split symbols in 2 columns: Set true if you want to show more symbols on the dashboard by splitting the symbols into 2 columns.
- Header Color: Color of the header of the dashboard .
- Text Color: Color of symbol and timeframe text.
- Dashboard Background Color: Color of the background of dashboard.
- Cell Background Color: Color of the background of cells.
- Border Color: Color of borders of the dashboard and its cells.
- Color for Bullish patterns: Color for the text of bullish candlestick patterns.
- Color for Bearish patterns: Color for the text of bearish candlestick patterns.
- Color for Neutral patterns: Color for the text of neutral candlestick patterns (doji and double inside patterns).
- Resistance zone color: Color for cells that show resistance zones.
- Support zone color: Color for cells that show support zones.
- Height of Dashboard Rows: Height of the dashboard rows.
- Width of Symbols Column: Width of first column of the dashboard that shows the symbol names.
- Width of Timeframe Columns: Width of other columns of the dashboard .
- Dashboard Distance from Left: Dashboard distance from left of the chart.
- Dashboard Distance from Top: Dashboard distance from top of the chart.
- Text Font Name: Font name of dashboard text.
- Font Size: Font size of dashboard text.
- Draw dashboard behind the price chart: If set to true, the dashboard will be drawn behind the chart candles.
- When clicking on the dashboard cells: Save a template with default.tpl or custom.tpl name, then use this option to open the new chart with one of them.
- Show S/R zone in opened chart: After clicking on table cells, show S/R zones in opened chart.
- Highlight pattern in new chart: After clicking on table cells, highlight the candlestick pattern in opened chart.
- Custom template name for opened charts: Template name for opened chart, if you want to open chart with custom template.
- Auto open chart when pattern detected: Automatically open the chart to show the pattern after pattern detected. So after one candle that the pattern disappears from the dashboard, you still can check it on the opened chart.
How to use the Candlestick Pattern Scanner Bridge in expert advisors:
This bridge is a fast and lightweight version of Candlestick Pattern Scanner (a separate file from the main scanner) that you can use in the code of expert advisors and indicators to check different candlestick patterns and S/R zones for all metatrader timeframes.
Graphical objects are removed from the bridge but all necessary options are preserved so you can control the specs of patterns like the main scanner.
There are 2 buffers in the bridge that you can load them with iCustom function in your EA or indicator code to check if a candlestick pattern formed in the chart and if the pattern or chart price is inside a support or resistance zone. With these buffers you will have the type of the patterns and the type (support, resistance) and strength (weak, broken, untested, verified, proven) of the zones for all chart timeframes.
So in your EA you will have 2 buffers, 1 buffer for candlestick pattern type and 1 buffer to show S/R zone type and strength, each buffer has 9 value for 9 timeframe of MT4 (21 values for 21 timeframe of MT5), first value for M1 and the last value for MN1 timeframe. For example you can name buffers such as:
- pattern_type[] // type of the candlstick pattern for all timeframes
- sr_zone[] // type and strength of support resistance zones for all timeframes
Each of the above buffers will have 9 (for MT4) or 21 (for MT5) values. For pattern_type buffer each value can be between 0 and 31 (representing candlestick pattern type) and for sr_zone buffer each value can be between 0 and 10 (representing S/R zone type and strength) .
- If the value of the pattern_type buffer for a timeframe is 0 this means there is not any pattern in that timeframe.
- If the value of the pattern_type buffer for a timeframe is not 0 and the value for sr_zone buffer is not 0, this means candlestick pattern formed inside a S/R zone.
- If the value of the pattern_type buffer for a timeframe is 0 but the value for sr_zone buffer is not 0, this means chart's price is inside a S/R zone.
For MT4, the range of arrays will be from 0 to 8, 0 for the M1 timeframe and 8 for the MN1 timeframe. For example:
- pattern_type[0] is for the M1 timeframe and its value shows the pattern type (for example 4 means hammer pattern)
- sr_zone[5] is for H4 timeframe and its value shows the type and strength of S/R zone (for example 8 means untested resistance zone)
For MT5, the range of arrays will be from 0 to 20, 0 for the M1 timeframe and 20 for the MN1 timeframe. For example:
- pattern_type[0] is for M1 timeframe and its value shows the pattern type (for example 4 means hammer pattern)
- sr_zone[4] is for M5 timeframe and its value shows the type and strength of S/R zone (for example 4 means verified support)
- sr_zone[14] is for H4 timeframe and its value shows the type and strength of S/R zone (for example 8 means untested resistance zone)
You can see the meaning of all the values for buffers in the sample EA you received with the bridge.
To see how to implement the bridge in your code, please refer to the sample EA you received with the bridge.
DOWNLOAD DEMO:
Demo version works on M4,M6,M12,H3,H8 timeframes (M30,D1,W1 for MT4 version) and 20 symbols of Market Watch window.