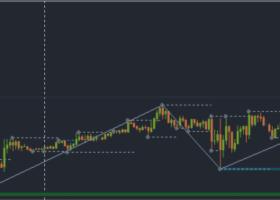
A large number of candlestick patterns are presented in the modern world. Not every kind of partner works well. Considering this fact, you should not rely on the indicators of trading candles. It is best to combine their indicators with other types of indicators while trading on the exchange. You don't need to memorize all existing candlestick patterns. The main thing is to understand what controls the market situation at the moment (bulls or bears).
Trading with candlestick patterns is possible only after training, which consists in reading charts. Without training, a technical trader will not be able to correctly build a trading strategy in the market.
The first candlestick patterns were developed back in the 18th century. The first reference to candlestick charting was found in Japan. Munehisa Homma used a similar system to trade rice in the market.
In the early 1990s, bar and candlestick charts were introduced. For the first time, Japanese candlestick charts appeared in the Western financial market, as well as candlestick patterns that were developed by Steve Neeson. Over the past decades, the level of popularity of candlestick charts among analysts of the trading markets has increased significantly. This factor is due to the fact that candlestick patterns show the likely outcome of a trade with a high level of accuracy. Using a candlestick chart, you can foresee the decisive outcome of a transaction in the financial market.
Advantages and Disadvantages of Candlestick Charts
If we compare the line chart and the candlestick pattern, we can conclude that the second indicator provides more information for analyzing the situation in the trading market.
The values given by the candlestick chart can be obtained using the bar indicator. For bars, horizontal lines are used along the side of the vertical ones in order to project the indicators of the opening and closing prices of the transaction.
A number of candles, which are located on the trading chart, help traders to know the most accurately the movement of the value of a currency pair, which is an important factor when making a decision.
Most of the professional traders gave their preference to the candlestick chart, because they interpret the possible indicators of price analytics in the financial market.
The use of candlestick charts makes it easier to interpret price movements in the market. It's worth noting that candlesticks lack the smoothness that a linear trading chart has.
It is because of this that experienced traders begin to use the moving average in a trade for a short period in order to determine the presence of a trading trend in the market.


