Classic Keltner Channel Manual
- Buy or rent CKC: https://www.mql5.com/en/market/product/24390
- CKC Expert Advisor Example: https://www.mql5.com/en/blogs/post/734150
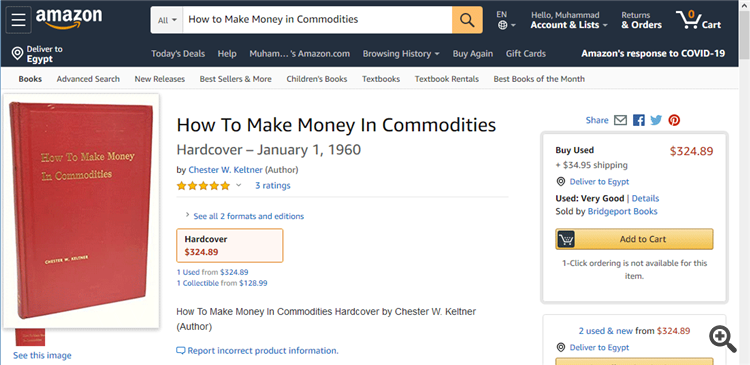
In January 1960 the legend "Chester W. Keltner" published his book "How to Make Money in Commodities". The book now is classic piece that cost over 300$ on amazon.
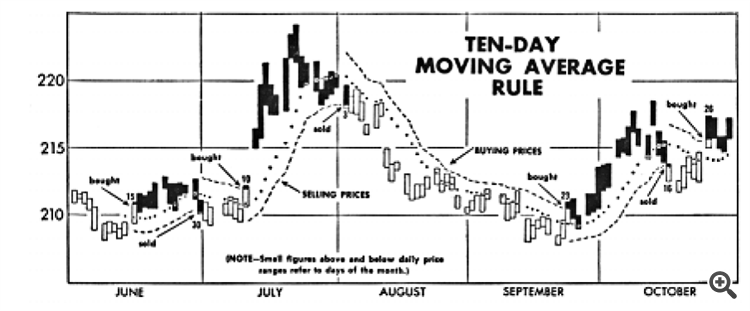
In his book, Chester Keltner introduced the "Ten-Day Moving Average Trading Rule," which is credited as the original or classic version of Keltner Channels. This classic version started with a 10-day SMA of the typical price {(H+L+C)/3)} as the centerline. The 10-day SMA of the High-Low range was added and subtracted to set the upper and lower channel lines.
The trading strategy is to regard a close above the upper line as a strong bullish signal, or a close below the lower line as strong bearish sentiment, and buy or sell with the trend accordingly.
Keltner was a Chicago grain trader and in the 1930s as a young man, Keltner worked for Ralph Ainsworth (1884–1965) backtesting trading systems submitted when Ainsworth offered a substantial prize for a winning strategy, so it could have been among those.
John Bollinger added to his book "Bollinger on Bollinger Bands" a chart that show how the system works. It was more like a "Start and Reverse System" than what most people use today.
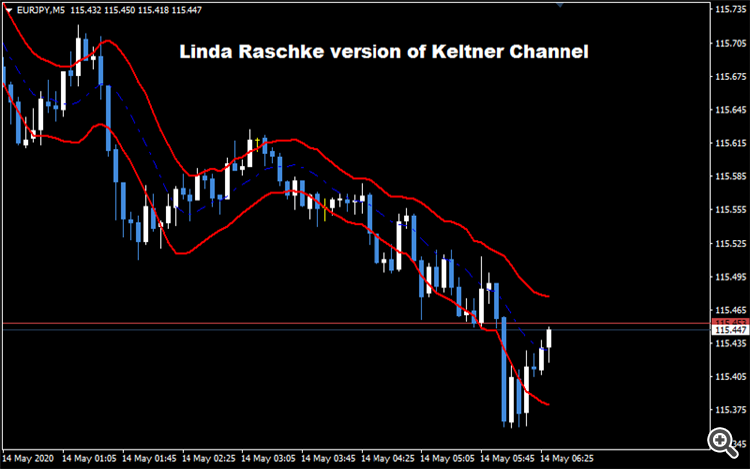
The current version of Keltner Channel which most traders use today came late in the 1980s from Linda Raschke who introduced her idea to the public with the same name. So, people forgot about the classic version and replaced it with the new one.
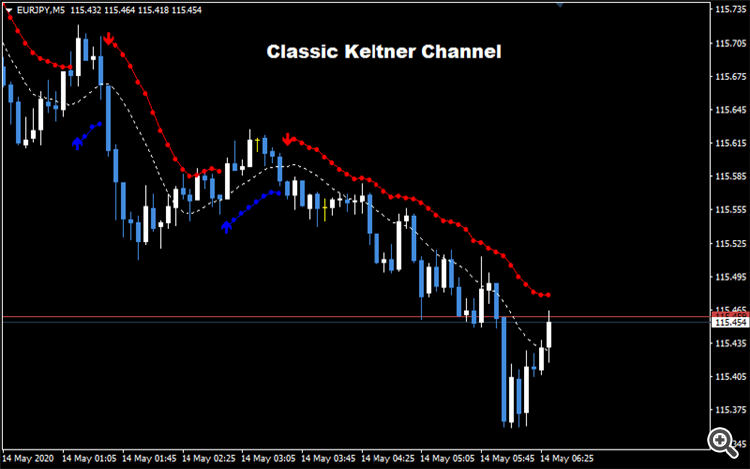
What I did is that I rebuilt the classic version of Keltner Channel because I found it with good potential in the field of technical analysis.
- I calculated a ten days simple moving average from the typical prices.
- I calculated ten days' simple average of the difference between the high and the low.
- Added them together to form the upper band.
- Subtracted them from each other to get the lower band.
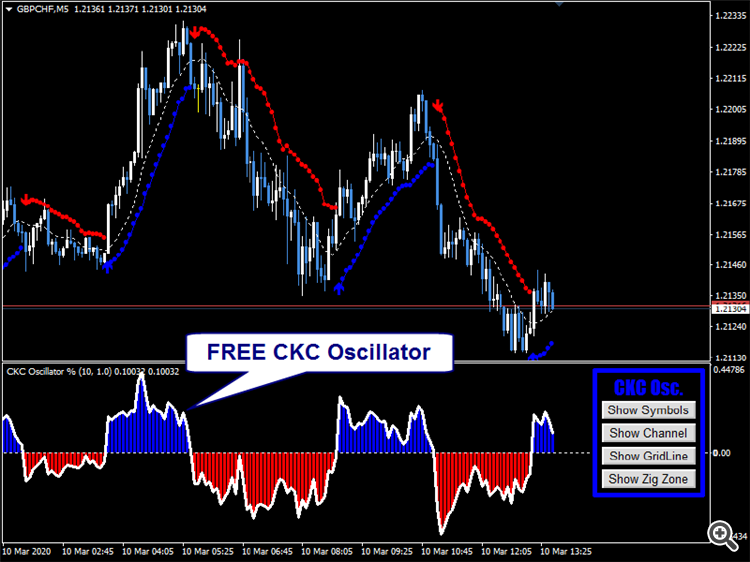
- I draw them as a start and reverse line with arrows to show when a trend changes its direction.
By this, we go back to the original version of the indicator as it was described in Chester W. Keltner's book.
BUT THAT IS NOT EVERYTHING
If you buy CKC then I will give you the CKC Oscillator for FREE!
The CKC Oscillator shows the CKC as an oscillator that moves around zero. Above zero alerts for a buy signal, while under zero alerts for a sell signal. It is also a good tool to see the momentum of the trend and if it is healthy enough to continue.
The CKC Oscillator contains the Bermaui utility built-in it. You will find it in the right corner of the oscillator.
The Bermui utility contains four tools:
- A Symbol switch tool to help you switching between different symbols or time frames easily, without opening different charts.
- The Standard Deviation Channel, which helps you to see overbought and oversold areas on the chart.
- A rounded numbers grid to help you find psychological support and resistance levels.
- The Supply and Demand levels on the chart.
When you combine those tools together you can easily find your targets and stop-loss levels.
Steps to have it
1. Buy or rent CKC from here: https://www.mql5.com/en/market/product/24390
2. Send me a private message.
Enjoy the game
Muhammad Al Bermaui, CMT
![[MANUAL] - CLASSIC KELTNER CHANNEL [MANUAL] - CLASSIC KELTNER CHANNEL](https://c.mql5.com/6/862/splash-736577-1589447541.png)
