|
Hey! This is Philip
with this week's
trade idea of the
Free Profitable
Forex
Newsletter!
Markets are trading on edge despite the
recovery in risky assets last
week as the coronavirus
pandemic is now spreading in
full force across the United
States. It is already well
clear that this crisis, which
at its core also has a medical
crisis, will be bigger than the
2008-09 financial crisis.
Corona Crisis Keeps
Markets Nervous
Markets are not expected to
calm down before the
medical situation is
under control. As a
result, more wild
market action is
likely, and traders
are having their
guards up
high.
With that said,
it is not very
useful to look for
trades based on
fundamentals in a
time when
fundamentals matter
little, and instead,
liquidity and rapid
newsflow are the main
driving force of
prices.
In all this, technicals
and price patterns
can be very valuable
because they provide
clear levels for our
trades.
Such is the
example of the
potential EURJPY Buy
trade that we are
discussing below.
Buying Opportunity:
Double Harmonic Support
On EURJPY 1H Chart
The Harmonic patterns are
great in times of high
uncertainty like now
because they still give
very reliable signals
and, at the same time, that
comes with relatively
tight stops. This enables
excellent risk-reward
ratios more often than
not. And nothing is more
important for trading in
volatile times than
keeping your risk at a
minimum.
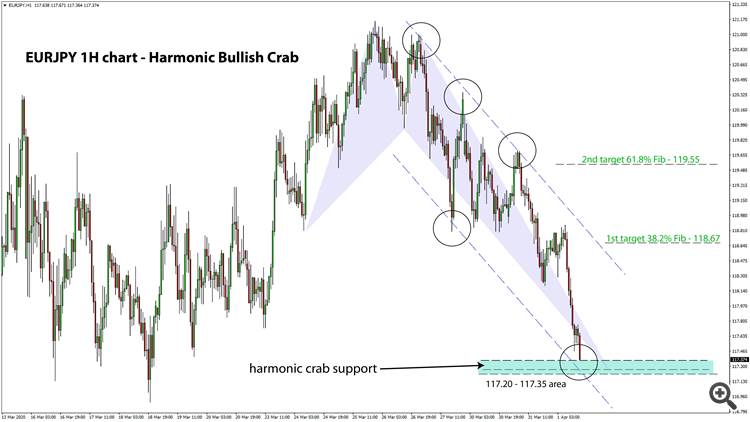
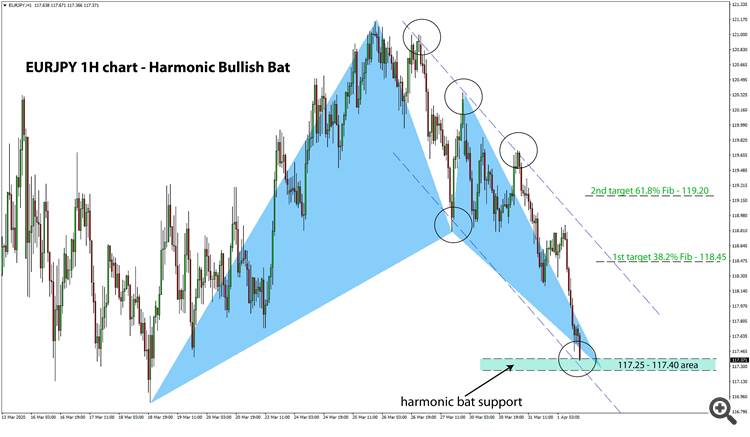
As I am going to show in two
separate charts below,
the confluence of
harmonic zones of these
two patterns means that
this 117.20 - 117.40 area
is robust support for
EURJPY now, making the
case for a bounce highly
probable.
The
pair is just entering this
area as of the moment of
writing.
The Harmonic Bat:
- As
can be seen from the
bullish bat pattern,
shown on the chart above,
its harmonic support
zone is in the 117.25 -
117.40 area.
-
The two targets of
this pattern (those are
the 38.2% and 61.8% Fib
retracements) are at
118.45 and 119.20.
-
That gives a potential
profit of 100 - 200 pips.
The Harmonic Crab:
- The
situation is similar with
the crab pattern as well,
shown on the chart below.
-
Its harmonic support
zone stands at 117.20 -
117.35 - closely
overlapping the support
of the bat pattern.
-
The specific 38.2%
and 61.8% Fib targets of
the crab are at 118.67 and
119.55, close but
slightly higher than the
bat.

In
addition to the two patterns, there is
the downward channel that has its
support trendline coming into the same
area as the double harmonic support
area.
All of this makes a case for
a EURJPY rebound in this area
that much more likely.
Note: the
two charts above are exactly
the same, they are just showing
the two different patterns.
-
Look to buy in the
above-described
confluence support
area of the Bat and
Crab
patterns.
-
The two zones
overlap to form a
confluence zone of
117.20 - 117.40.
-
Keep in mind, as
the price tests this
area, it may dip
slightly lower than
the low, but that is
fine as long as it
bounces back
quickly.
Stop loss:
-
Look to place
a tight stop just
below
this 117.20
- 117.40
confluence
support
zone.
-
Some 10 - 20
pips lower is
fine to allow
some greater
breathing room
for the trade.
Targets:
-
Aim for the Fib
targets
described/shown
above.
-
Since the bat
pattern has the
targets slightly
lower, you can aim for
them as a safety
measure and take
profits at those
target levels. The
price, though, may
achieve the targets
of both patterns.
|
|
|
|


