CURRENCY STRENGTH MATRIX - UNIQUE INDICATOR FOR TREND AND MOMENTUM TRADERS
..............................................................................................................................................................
----- Check out our blog updates at the bottom of the page, highlighting trading opportunities and signals using this indicator. And also a FREE trading tool to all clients. -----
..............................................................................................................................................................
Do you trade FX and want to find high probability trades quickly? The Currency Strength Matrix Indicator has been specifically designed for trend and momentum traders in the FX market, to help you identify the best currency pairs, with the strongest trends and momentum.
- Quickly and easily identify all trending markets
- Makes forex trading easier than ever before
- Analyses 28 currency pairs simultaneously to calculate currency strength
- Ranks each currency in order of strength, in each time frame
The nature of currency trading means we are always trading one currency against another and the value of each currency will change based on their relative strength to each other. Being able to measure this relative strength in real time gives currency traders a significant advantage in the currency market.
- Find strong and weak currencies with ease
- Gives a great confirmation on trades you want to take
- If a currency is getting stronger, look to buy
- If a currency is getting weaker, look to sell
The ultimate currency strength indicator
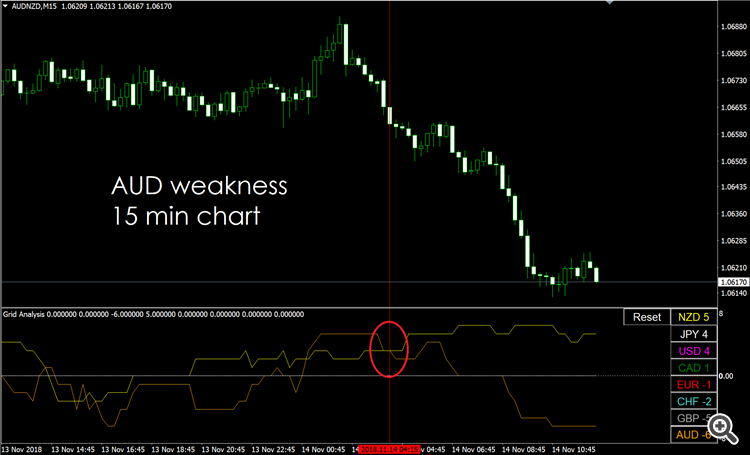
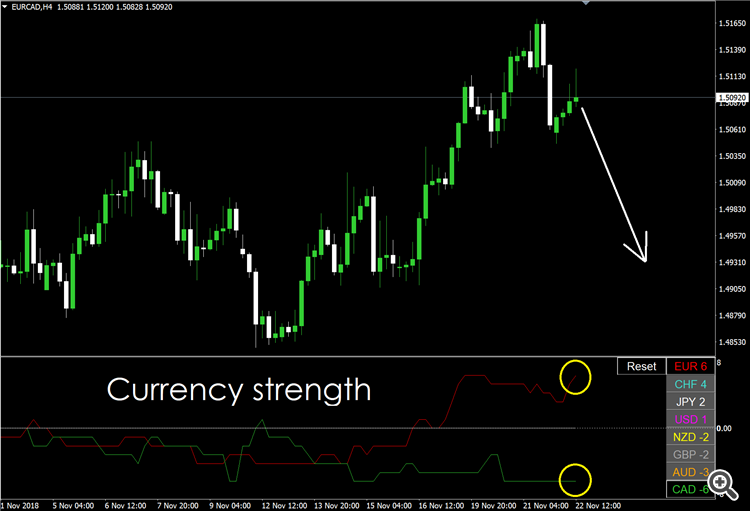
This indicator intelligently reads price action to confirm trend and strength in real time and on any time frame. This advanced multi-currency and multi-time frame indicator, shows you simply by looking at one chart, every currency pair that is trending and the strongest and weakest currencies driving those trends.
- Currency strength changes every time an existing trend is broken or new trend begins
- Strength is calculated by reading price action, the only true measure of strength
- Works in conjunction with any trend-based trading strategy
- Will ensure you choose the highest probability currency pairs to trade
Video - How to trade using Currency Strength
Anatomy of the indicator
Currency trading is unique because it involves trading two markets against each other. As a result, currency traders are always looking for one currency to outperform another. We must, therefore, be able to determine which is a strong, and which is a weak currency so we can expect an out-performance to occur.
This indicator looks at 8 major currencies and evaluates their performance relative to each other (28 pairs in total, listed below) to determine which is the strongest and which is the weakest. This is done by analysing the current price action and trend in each currency pair, in each time frame. The more trends a currency has in its favor, the stronger that currency is. If a currency is in up trends against the other 7 currencies, it will achieve the maximum score of 7, conversely, if a currency is in downtrends against the other 7 currencies, it will achieve the minimum score of -7. Pairing together currencies with maximum and minimum score will mean you are trading markets in the strongest trends.
Currency pairs analysed. AUDUSD, EURUSD, GBPUSD, NZDUSD, USDCAD, USDCHF, USDJPY, EURAUD, EURCAD, EURGBP, EURCHF, EURNZD, EURJPY, GBPAUD, GBPCAD, GBPCHF, GBPNZD, GBPJPY, AUDCAD, AUDCHF, AUDJPY, AUDNZD, NZDCAD, NZDCHF, NZDJPY, CADCHF, CADJPY, CHFJPY
How to read the indicator
Trend
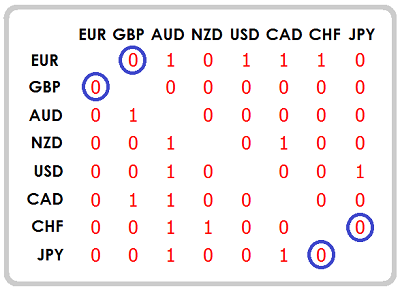
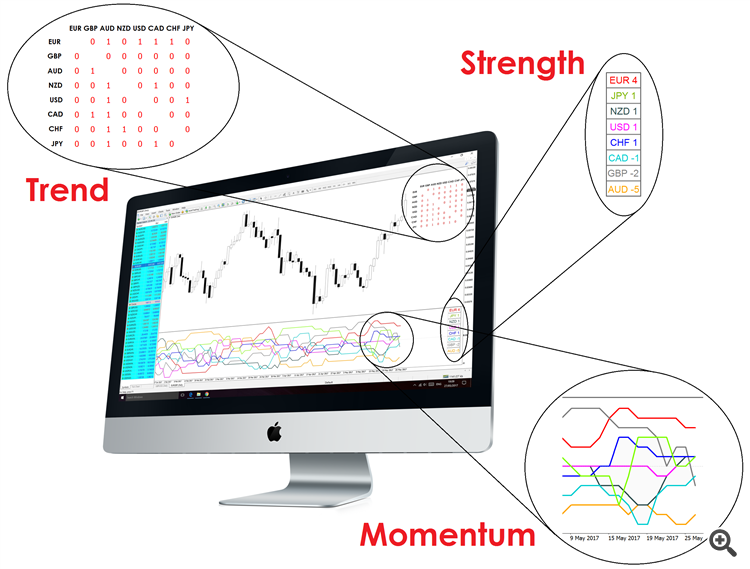
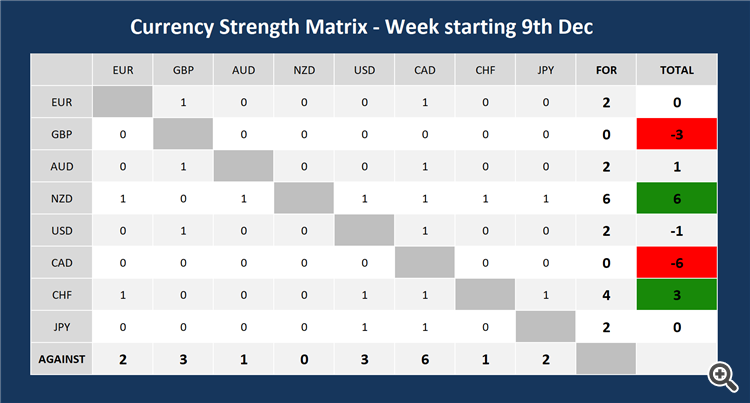
This table allows you to quickly see which pairs are currently trending and in which direction. Each '1' denotes trend, if the base currency in a pair has a '1' that pair is in an uptrend, if the terms currency has a '1' then that pair is in a downtrend.
Base currencies in each pair are in the upper right half of the table, the terms currency in each pair are in the lower left half. E.g. the first currency pairs observed is EURGBP and the last is CHFJPY (both pairs are circled here).
Strength
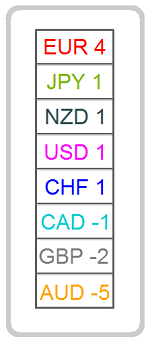
The strength table shows the total score for each currency, and ranks each currency in order, with the strongest at the top and weakest at the bottom. The total score is the 'horizontal' score, less the 'vertical' score for each currency, taken from the trend table. In the table above you can see that EUR has a horizontal score (EUR row) of 4 and a vertical score (EUR column) of 0, giving the Euro a positive strength score of +4.
Momentum
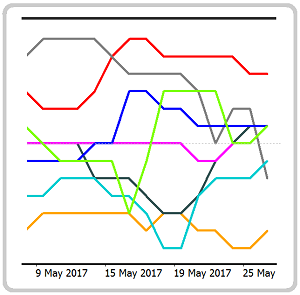
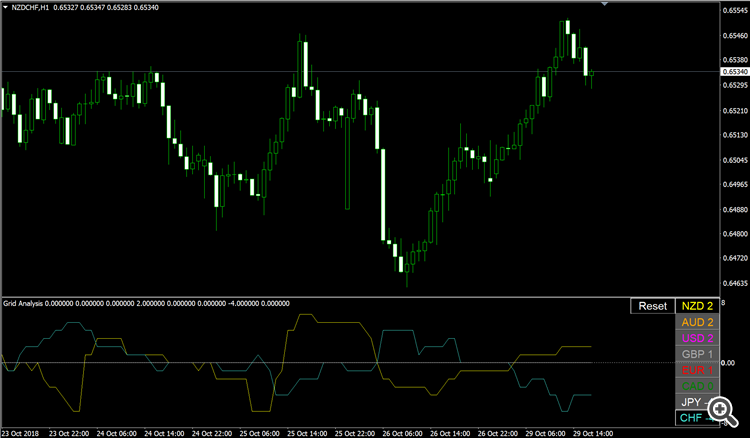
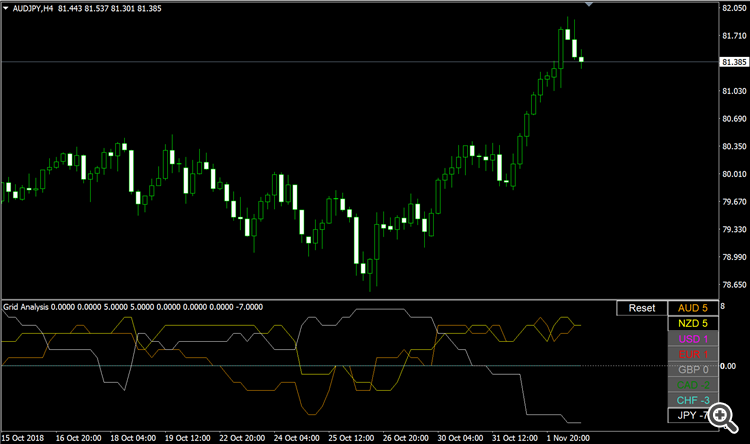
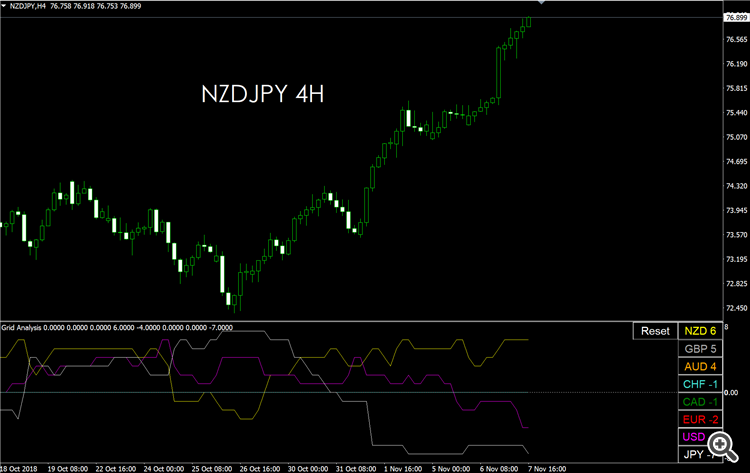
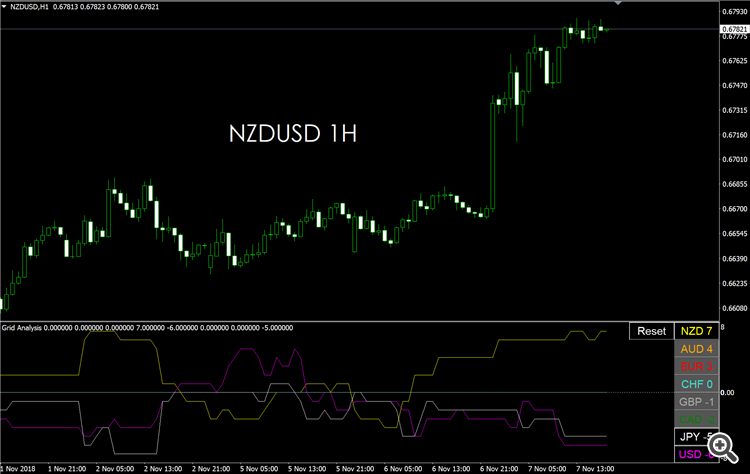
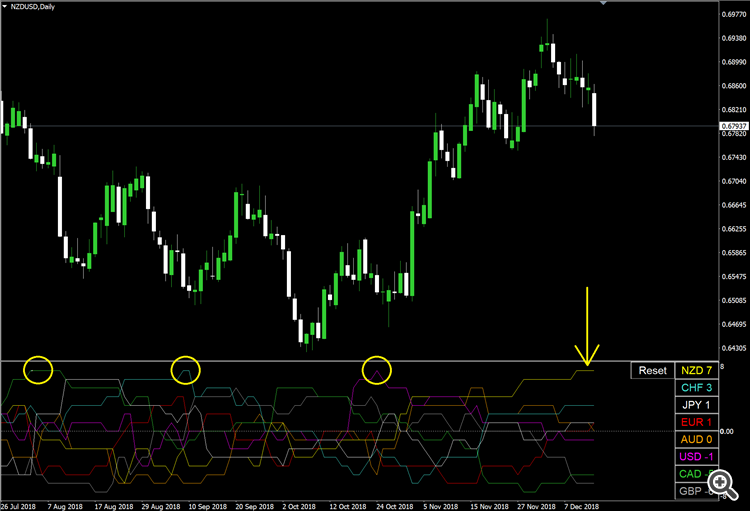
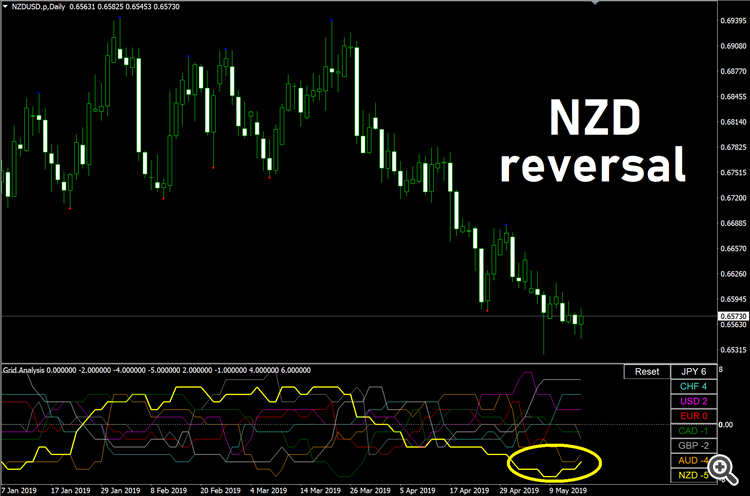
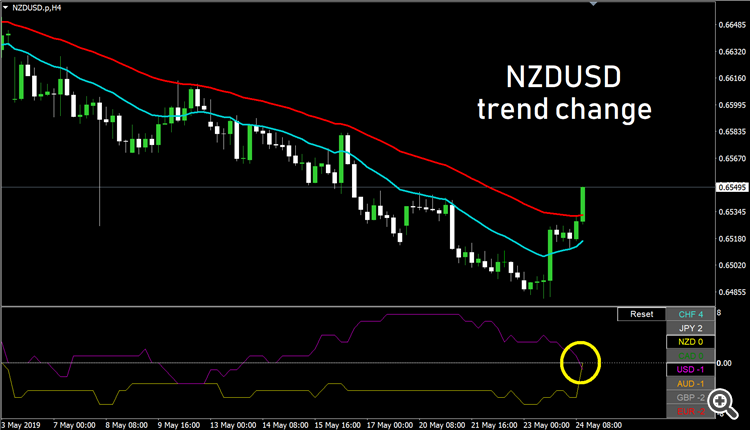
This is the last piece of the indicator but the most important. Like the 'Strength' table this also shows us what the current strength scores are but crucially this also shows us if that score is increasing or decreasing, as it plots the strength history.
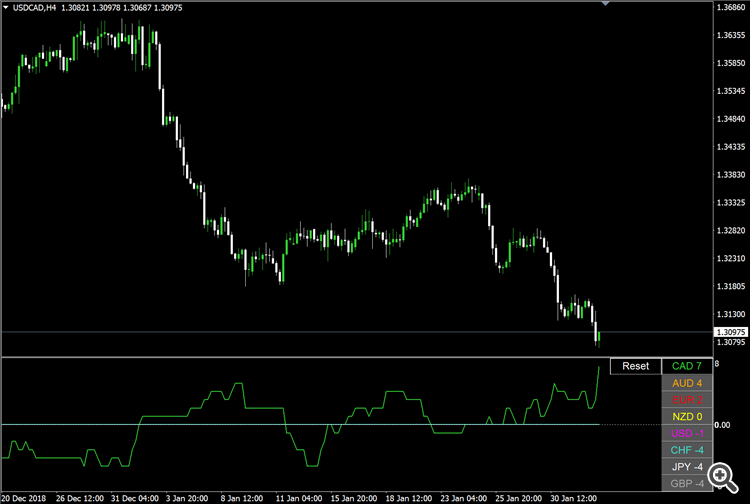
A strong currency must have increasing strength while a weak currency must have decreasing strength. Momentum driving a currency can be seen from the angle of the increase or decrease. The steeper the angle the stronger the momentum.
Video - What is the Currency Strength Matrix
How to trade using Currency Strength Matrix
Currency Strength Matrix can be used in conjunction with any existing trend trading strategy. Currency strength precedes a strategy, which means the indicator will help you choose which pair to trade before implementing your existing strategy to determine your point of entry.
There are three distinct stages of trend and Currency Strength Matrix can be used to find and trade all three, These are, Beginning, Early, and Confirmed. To help you understand how the indicator signals these stages, we go through examples of each stage in detail below, starting with the safest stage to trade and finishing with the most aggressive.
The 3 stages of trend
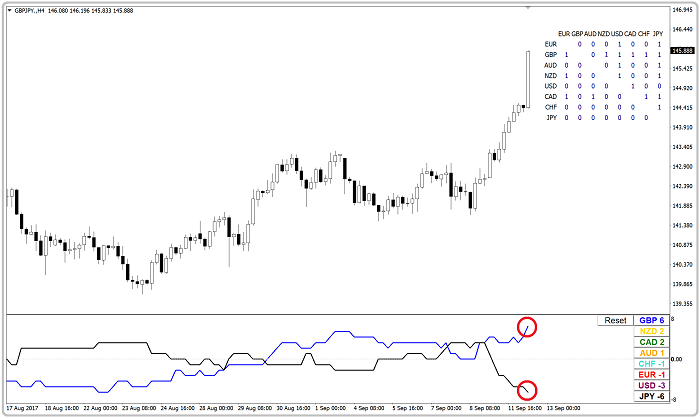
'Confirmed trend' is when a market has already produced at least two cycles in the same direction. This is the safest and easiest market conditions to trade. Currencies in this state will already have confirmed strength and weakness and will be found at the opposite ends of the Currency Rank table.
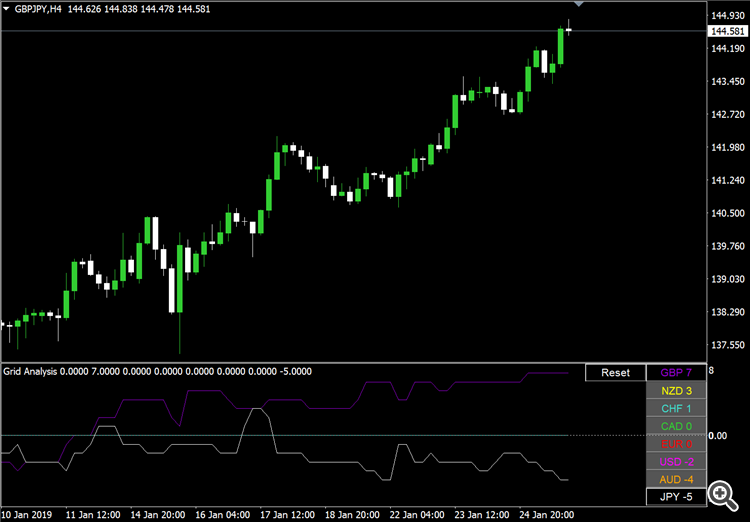
Below is a chart of GBPJPY, this market is already trending and GBP has a strength score of +6 and increasing while JPY has -6 and decreasing, which we can see from the angle of both currencies strength lines.
Tip - When trading these conditions, always pair together a strong currency with a positive score of 5, 6 or 7, with a weak currency with a negative score of -5, -6 or -7. These conditions will ensure you are always trading with an existing trend.
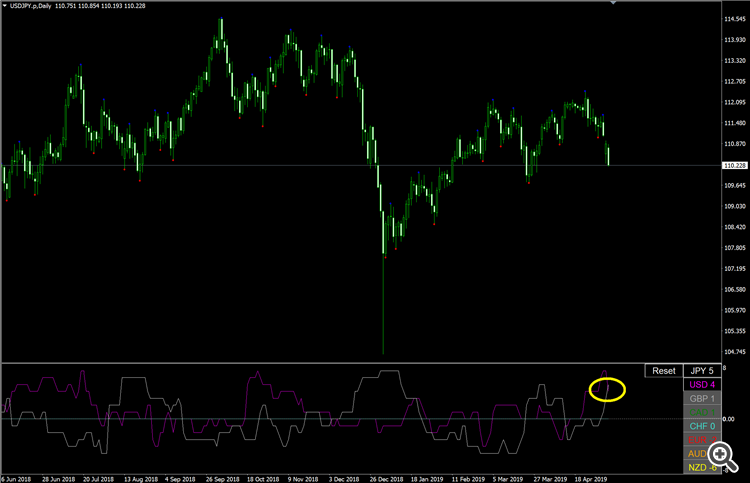
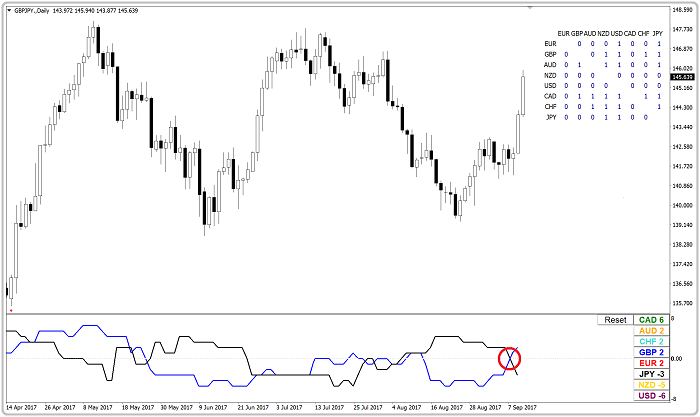
'Early trend' is when a market is showing signs of forming a new trend but the trend has not yet been confirmed. Typically this market will have completed only one cycle in its current direction. These conditions are often seen after a break of a previous trend. A currency crossing up through the 0 line shows it is gaining strength against other currencies, having previously been weak, while one crossing down through the 0 line shows it is losing strength having previously been strong, pairing these together will see you trading a pair experiencing a momentum shift in favour of the strengthening currency.
Below is a chart of GBPJPY, GBP has a current score of +2 which has increased rapidly from -5. JPY, on the other hand, is at -3 having been as high as +4. They both cross sharply signaling there is strong momentum behind both currencies. This is an excellent signal for early-stage trend traders.
Tip - When trading these conditions, look for currencies that have come from low/high scores before they cross, not a currency that has been at -1 or +1 for some time or has crossed through the 0 line already recently. there is no momentum behind that currency. The angle of the strength line is key. These conditions will have you trading within the early cycles of a new trend.
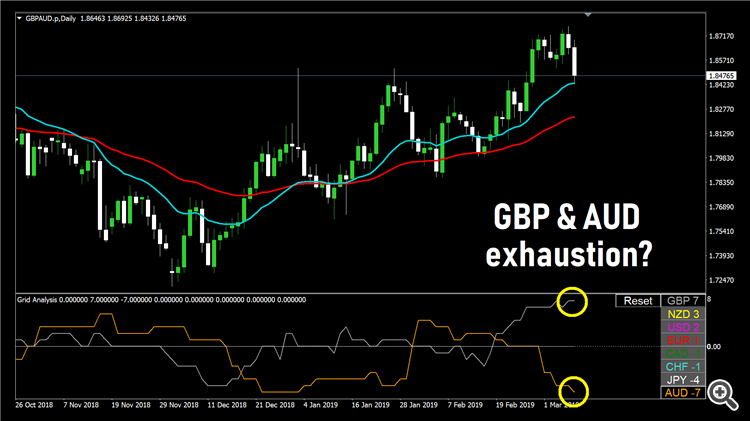
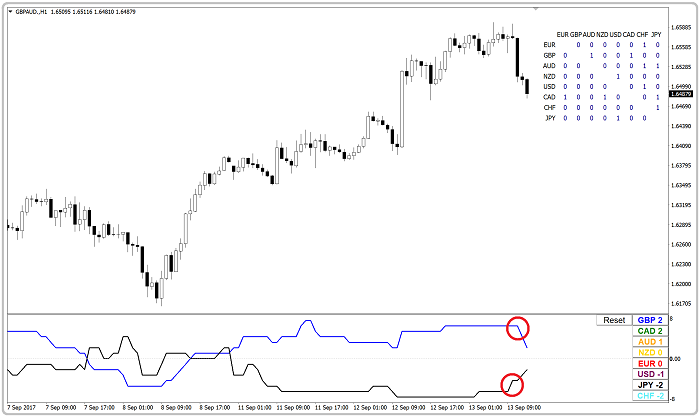
'Beginning trend' is when a market has been trending but that trend is now losing momentum and beginning to turn the other direction. In this stage you want the strength of two currencies to reverse and turn towards each other sharply, a strong currency turning downwards and a weak currency turning upwards.
The GBPJPY chart below shows a prolonged uptrend that has got slowly weaker as we near the end. The first signal of the turn is when GBP strength line turns down and JPY strength line turns up. An entry here inline with new momentum is very risky but also very rewarding, as this is potentially the very beginning of a new downtrend.
Tip - When trading these conditions, look to pair a strong currency which is losing strength (was at +7 and dropping to +5) with a weak currency gaining strength (at -7 and increasing to -5). These conditions are the most aggressive but will have you trading right at the beginning of new trends. We recommend only experienced traders trade this signal.
What people are saying about the Currency Strength Matrix
Settings and Parameters
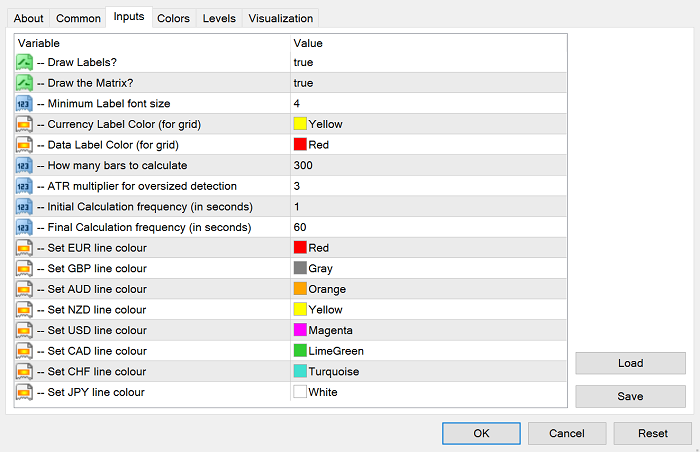
On first loading the indicator, you will be presented with a set of options as 'input parameters'. These are designed to help you get the most from the indicator and will allow you to optimise settings such as load speed, colour preference, and text size. They are easy to understand but if there is any doubt we have outlined below what they each mean.
Draw Labels: With this setting, you can choose to turn off all currency Rank table and Matrix table's and just use the strength indicator lines at the bottom of the chart.
Draw the Matrix: This setting allows you to turn on and off the Matrix table on its own. When set to true it will show on the top right corner of your chart.
Minimum label font size: You can choose the size of text in the Matrix table and Rank table. You can optimise this based on your screen size and resolution.
Currency Label Color (for grid): This sets the color of the currency titles in the X and Y axis of Matrix table.
Data Label Color (for grid): This sets the color of the 0 and 1 scores in Matrix table.
How many bars to calculate: Set how many bars should be calculated and this will set how far the indicator lines extend back in history. By default the indicator will calculate the last 300 bars on any time frame, you can increase this number if you wish to extend history for backtesting purposes. We recommend a minimum of 50 bars.
ATR multiplier for over-sized detection: This has been added to eliminate over-sized bars from the chart (over-sized bars greater than chosen ATR will not be counted in cycles analysis), so that the indicator can still focus on the true cycles. The default ATR is 3 but this can be amended to take into account larger or smaller bars. We recommend 3 as a starting point for all users.
Initial calculation frequency: This is the speed in which the 300 bars are read on first load. You can adjust the speed between 1 and 10 seconds. Modern PC's and laptops can run no problem between 1 - 3 seconds, older machines may need more time to calculate the bars.
Final calculation frequency: This is the frequency in which the indicator checks price action for changes in cycles and therefore scores, but after all 300 bars have been fully loaded.
Set EUR line colour: This allows you to change the colour assigned to each currency as it is presented in the Rank table and strength lines.
Download today and join the thousands of traders around the world who already
use our Currency Strength Matrix for their market analysis and selection.
Download includes...
Lifetime technical support and unlimited free software updates
Need help installing? Check out our installation video HERE
*************************************************************************************************************************************
--- FREE MT4 trading tool for all our loyal clients ---
EASY DRAW makes using MT4 much more efficient, it will save you time, and the analysis process as you go from market to market much easier than the standard MT4 process. For more info on Easy Draw, watch this VIDEO.
To get your free copy, all you have to do is follow these 3 simple steps:
- Download our Currency Strength Matrix indicator.
- Have used the indicator for at least 1 week and are happy with the indicator and our service.
- Email info@marketsmadeclear.com to confirm your download.

