Trading recommendations
Sell Stop 0.7280. Stop-Loss 0.7340. Take-Profit 0.7240, 0.7115, 0.7100, 0.7085, 0.6975, 0.6900, 0.6860
Buy Stop 0.7350. Stop-Loss 0.7280. Take-Profit 0.7380, 0.7420, 0.7500, 0.7550

Technical analysis
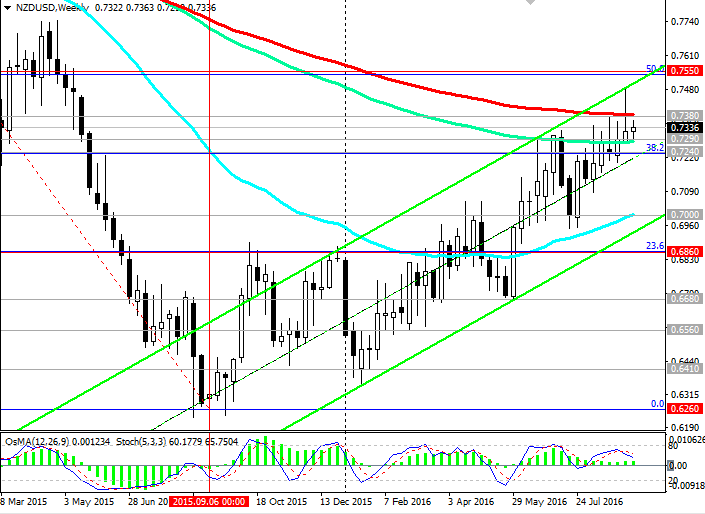
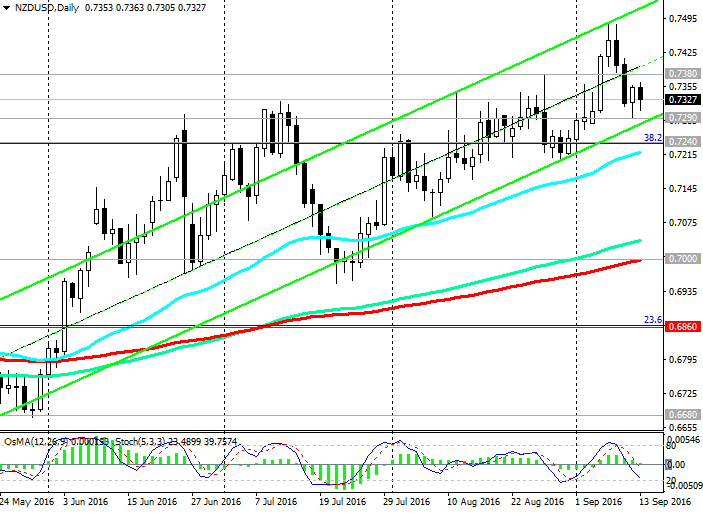
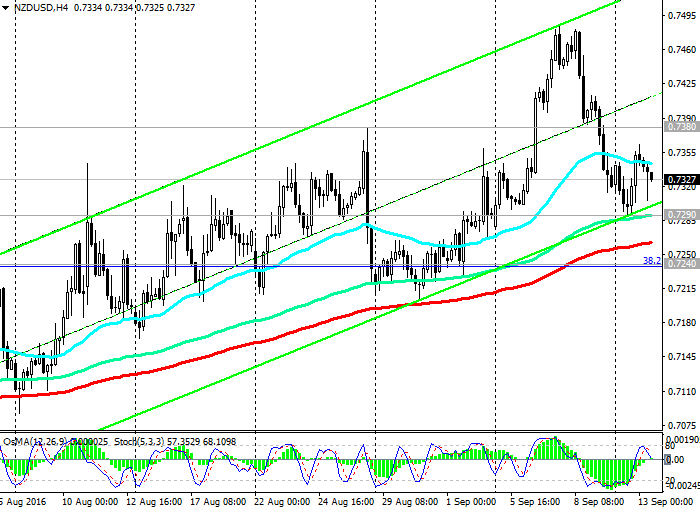
The pair NZD/USD remains in ascending channel on the weekly chart last week and made an attempt to break the resistance level 0.7380 (EMA200 on the weekly chart). The upper boundary of the rising channel on the weekly chart is held near the level of 0.7550 (Fibonacci level of 50.0%). This strong support is at 0.7290 levels (EMA144 on the weekly chart) and 0.7240 (38.2% Fibonacci level of upward correction to the global wave of decrease in pair with the level of 0.8800, which began in July 2014, EMA144 on the monthly chart). The pair NZD / USD rebounded from the support level 0.7290 (EMA144 and the lower boundary of the rising channel on 4-hour chart, EMA144 on the weekly chart) after comments from Fed officials about the probability of rate hikes in the US in September.
In the event of a confirmed break 0.7380 resistance likely to further increase its resistance level 0.7550 (50.0% Fibonacci level) level that would signal the end of a downward correction and return to the global upward trend (in monthly scale). This scenario, however, can be realized only with the support of the fundamental factors (preservation of interest rates in the United States and New Zealand at the current levels, the rise in prices of commodities, including dairy products, strong macro New Zealand data and weak US). If we come to the fore different directions of the monetary policy of the Fed and RBNZ, then the pair NZD / USD above the highs reached earlier this month near the 0.7485 mark may not take place.
OsMA and Stochastic indicators (on time-frames 4-hour, daily, weekly) recommend short positions, on a monthly chart - are on the side of buyers.
In case of breaking the support level of 0.7240 is more likely to further reduce the level of 0.7000 (EMA200 on the daily chart and the lower line of the rising channel on the weekly chart). The breakdown of the level 0.6860 (23.6% Fibonacci level) may cancel the uptrend.
Support levels: 0.7290, 0.7240, 0.7200, 0.7115, 0.7085, 0.7050, 0.6975, 0.6930, 0.6900, 0.6860
Resistance levels: 0.7380, 0.7420, 0.7550

Overview and Dynamics
On Tuesday (22:45 GMT) will be published data on the current account for the 2nd quarter of New Zealand's balance of payments, and on Wednesday (22:30 and 22:45 GMT) - the index of business activity in the manufacturing sector (PMI) in New Zealand in August, which assesses conditions in the business environment of the country and is considered an important indicator of overall economic conditions, as well as New Zealand GDP for the 2nd quarter. For the previous period figures have come out with pretty good values. GDP in the first quarter gained 0.7% and 2.8% (in annual terms), manufacturing PMI in July was equal to 55.8. A result above 50 indicates an increase in activity and a positive factor for the NZD.
Yesterday's statement by the Federal Reserve Lael Brainard led to the fall of the US dollar against most currencies, including against commodities and commodity currencies such as the Canadian, Australian and New Zealand dollars. Brainard said that "the tightening of monetary policy now looks less justified" in view of the situation on the labor market, and the "current state of affairs calls for a cautious approach to this issue." Other Fed officials, the president of the Federal Reserve Bank of Atlanta Dennis Lockhart, President of the Federal Bank of Minneapolis Neil Kashkari also hinted at the lack of urgency to raise rates in the near future.
Expectations for the Fed raising interest rates fell, and, in the case of positive data comes from New Zealand, the pair NZD / USD may resume growth. The decision on the interest rate in the United States and New Zealand will be published on 21 and 22 September, respectively.


