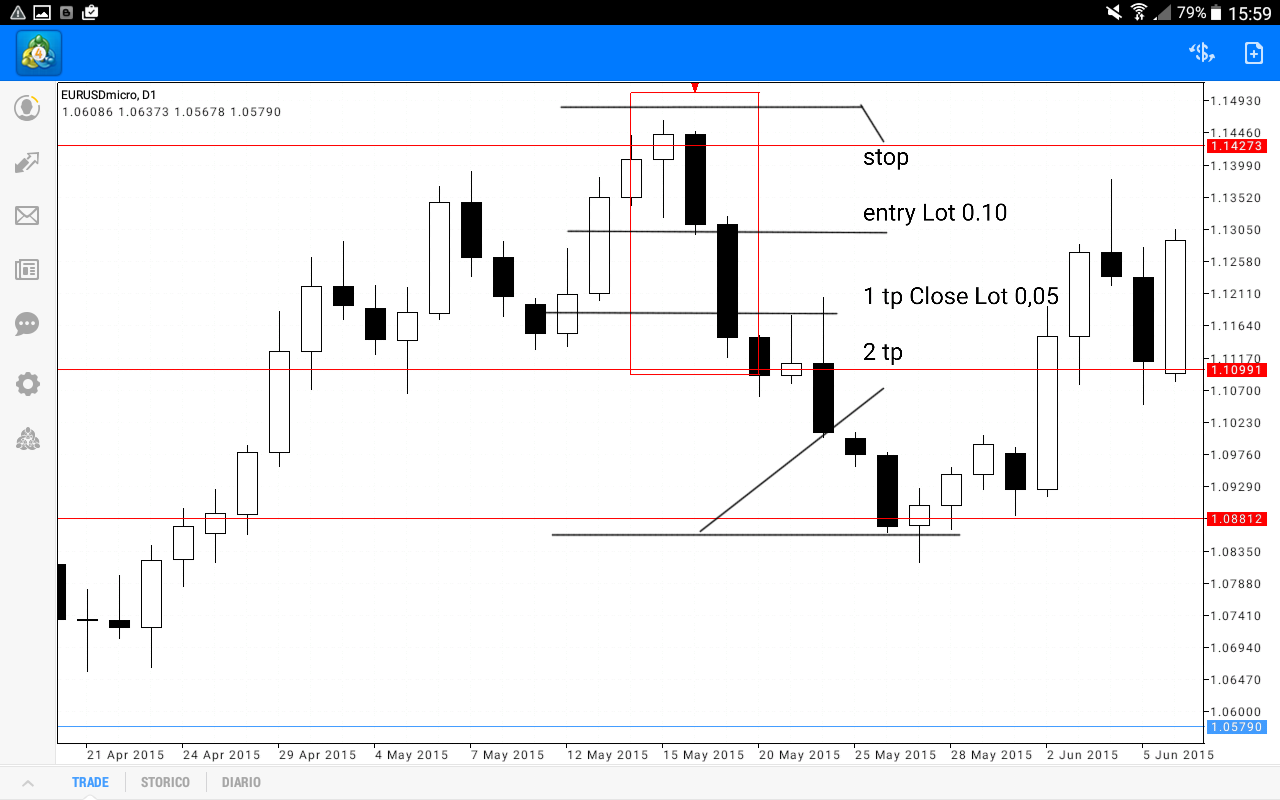
Then we start to see the first pattern is called the engulfing and a very powerful pattern of slow but better support and resistance can also be time you are trading on lower frame such as 15 minutes and 5 if not the 5 min up always with our filter that would be our support and resistance if you have well learned from the post I wrote before you will know to recognize them because it seems that there are also mini support and resistance, then no more talk here is the pattern

As we see the first bar trying to break our resistance the day after the price back down recovers all lost pips so you can close even below the minimum of the next day so we what we will do? We expect the new opening of the next candle so you can enter.
But be careful that we do not enter immediately sell and bho and away, pizza or a sell stop order below our bar so closed if the price goes in our direction will come to market in order to reach our goal in the end.
So now we see where to place stop and tp and especially Money management then we start the batch I do I open an account with 0.10 euro by 3000 those 100 Euros of account he opened 0.30 may not sound like much but that's okay. Our stop loss the squares oar as image above on our upper bars at a distance of a few pip no matter however for the tp works so let's assume that the price will behave as in the image posted after a certain pips 50 100 40 30 bho do close 0.05 as in my example that is my position was 0.10 I 0.05 I close and then open that location I move the remaining tp to draw tciòé to open the position if the price so I turn around I close in positive because half the closed most 30 or 40 Euros and the remaining if it goes down again then accompany always with the stop loss or close even further the remaining 0.05 to 0.04 type the port if not I accompany it with the stop loss up to where it comes from it's very simple.
More difficult to say than to explain


