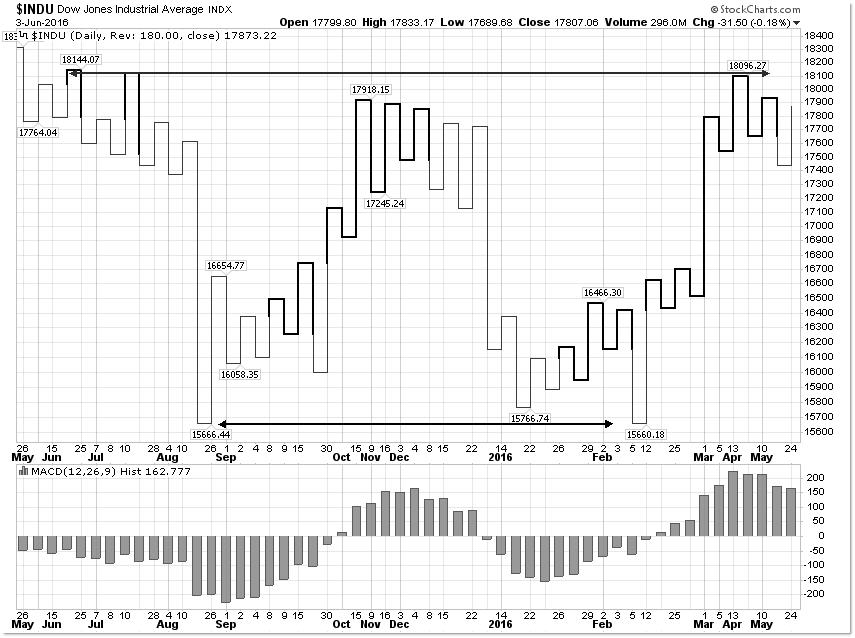
All Blogs / Analytics & Forecasts All Blogs Analytics & ForecastsWeekly TrendsForecastsTrading SystemsMy TradingChartsTrading StrategiesStatisticsTrading IdeasScalpingNeural NetworksWave CountMarket NewsCurrencyMetalsCrude OilCompany NewsEventsBanksBrokersLaw/RegulationsOther Rules Analytics & Forecasts Kagi chart & Dow Jones Industrial 5 June 2016, 22:04 Muhammad Elbermawi 0 126 Dow Jones Industrial Kagi Chart 1% shows support around 15660 & resistance around 18100.Forecasts is down trend to target 15000 before December 2016. To add comments, please log in or register How to run the EA on Prop Firm Challenges My Trading 29 0 Abiroid's Free Bollinger Bands Slope Explained Analytics & Forecasts 33 0 Top 3 NordFX Traders Earned Over $60,000 in September Company News 32 0 🔥🔥🔥🔥EA Trades 1.10.2024🔥🔥🔥🔥 Trading Systems 49 0 Full description of the Liquidity Zones EA parameters My Trading 83 0 AURA NEURON - HOW TO SET UP Trading Strategies 69 0 1 Bomb Bank Signal Analytics & Forecasts 35 0 The best scalping strategy for quick profit Trading Strategies 69 0 3 🔥🔥🔥🔥EA Trades 30.9.2024🔥🔥🔥🔥 Trading Systems 48 0 83 Full description of the Liquidity Zones EA parameters 33 Abiroid's Free Bollinger Bands Slope Explained 49 🔥🔥🔥🔥EA Trades 1.10.2024🔥🔥🔥🔥 technical analysis gold eurusd EUR/USD Fed forex forex news GBP/USD usd/jpy ECB Trading crude oil metals Ichimoku China S&P 500 fundamental analysis Mql5 News AUD/USD Mql5 Signals forecast news Mql5 Analysis VistaBrokers stocks usd gbpusd usdjpy bitcoin support