Morgan Stanley FX Chart Of The Week: Sensitivity Analysis
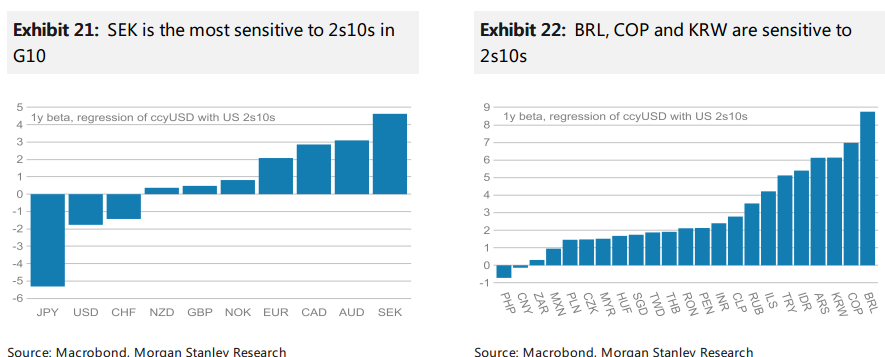
The US 2s10s curve has been flattening since the start of May. We have
run a regression analysis of each currency vs the USD against changes in
the US 2s10s curve.
In a flattening environment the SEK is expected to depreciate the most in G10 while the JPY appreciates the most. Within EM, BRL, COP and KRW are most sensitive to selling off.

Since the middle of April, oil has continued to rally together with the
USD, potentially the start of a breakdown in the inverse correlation. At
the same time copper has started to fall, while oil rallies.
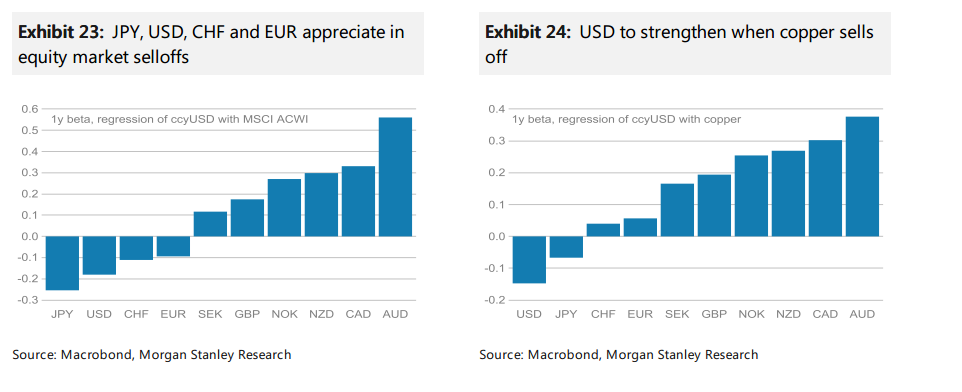
We
find that the AUD, CAD and NZD are most sensitive to depreciation if
copper falls. On the other side, the USD appreciates more than the JPY
in times of copper selling off. In contrast, the JPY appreciates more
than the USD in times of a global equities sell off, followed by the CHF
and the EUR.


