Brent: Pressure on the Price Continues
Weekly data released by the US Department of Energy last Wednesday showed the rise in the US oil reserves; which together with statement by Saudi crown prince Mohammend bin Salman, caused the decline in the price of crude oil Brent on Friday against the rise in the USD.
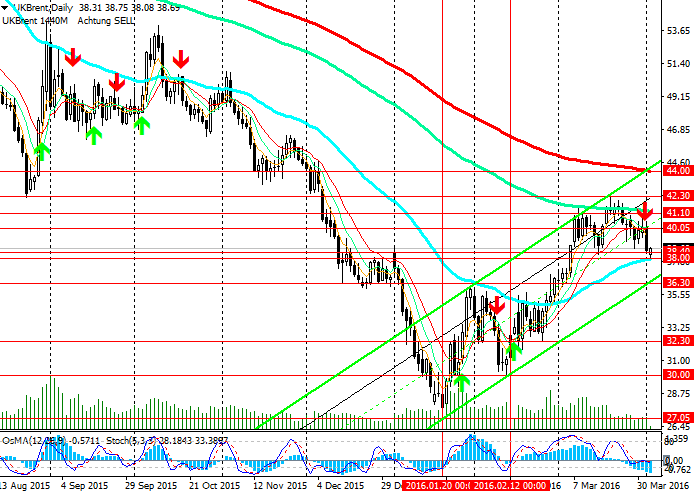
On the daily chart the first signal to sell has appeared from the price movement with short periods of 5-7-13 for the first time since 15 February.
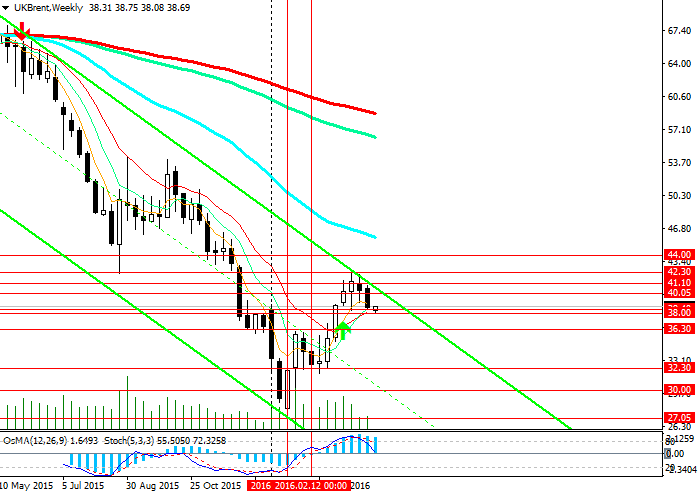
On the daily chart the indicators OsMA and Stochastic give sell signals; on the weekly chart the indicators are reversing towards short positions.
Breakout of support level of 38.40 (ЕМА200 on 4-hour chart), 38.00 (ЕМА50 on the daily chart) will bring the price to the level of 36.30, which is crossed by the lower line of the ascending channel on the daily chart.
In case of the further decline the price can fall to the level of 26.00.
Meanwhile the price is below the level of 41.10 (ЕМА144 on the daily chart), pressure on the price continues.
As an alternative scenario the price can break out resistance level of 41.10 and continue to rise to 42.30, 44.00 (ЕМА200 on the daily chart).
However, short-term short positions look more preferable.
Support levels: 38.40, 38.00, 36.30, 36.00 and 35.25.
Resistance levels: 40.05, 41.10, 42.30 and 44.00.
Trading tips
Sell Stop: 37.90. Stop-Loss: 38.40. Take-Profit: 37.00, 36.50, 36.00, 35.25 and 35.00.
Buy Stop: 39.10. Stop-Loss: 38.70. Take-Profit: 40.00, 41.10, 42.30 and 44.00.


The material has been provided by LiteForex - Finance Services Company - www.liteforex.com


