
USDJPY Price Action Analysis - symmetric triangle pattern to be formed for direction
15 October 2015, 06:11

0
1 247
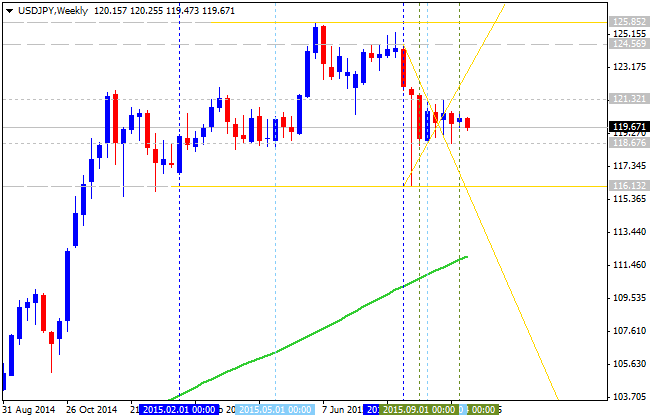
W1 price is located to be above 200 SMA and above 100 SMA with the
ranging market condition within the primary bullish:
- The price is on ranging between 125.85 resistance and 116,13 support levels.
- Symmetric triangle price pattern was formed by the price to be crossed direction.
- 'Reversal' support level is 102.52 located below 100 SMA and near 200 SMA on the border between the primary bearish and the primary bullish area of the chart.
- 'Reversal' resistance level is 125.85 key resistance located far above 100 SMA/200 SMA in the bullish area of the chart.
Trend:


