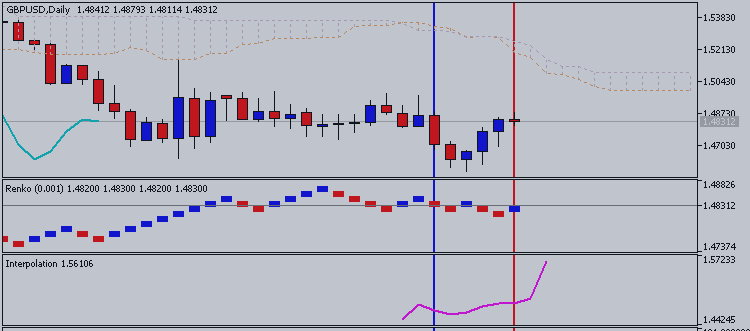
Ichimoku is a technical or chart indicator that is also a trend trading system in and of itself. The creator of the indicator, Goichi Hosada, introduced Ichimoku as a “one glance” indicator so that in a few seconds you are able to determine whether a tradable trend is present or if you should wait for a better set-up on a specific pair.

Before we break
down the components of the indicator in a clear and relatable manner,
there are a few helpful things to understand. Ichimoku can be used in
both rising and falling markets and can be used in all time frames for
any liquid trading instrument. The only time to not use Ichimoku is when
no clear trend is present.

The cloud is composed of two dynamic lines that are meant to serve multiple functions. However, the primary purpose of the cloud is to help you identify the trend of current price in relation to past price action. Given that protecting your capital is the main battle every trader must face, the cloud helps you to place stops and recognize when you should be bullish or bearish. Many traders will focus on candlesticks or price action analysis around the cloud to see if a decisive reversal or continuation pattern is taking shape.
In the simplest
terms, traders who utilize Ichimoku should look for buying entries when
price is above the cloud. When price is below the cloud, traders should
be looking for temporary corrections higher to enter a sell order in the
direction of the trend. The cloud is the cornerstone of all Ichimoku
analysis and as such it is the most vital aspect to the indicator.
Once you have built a bias of whether to look for buy or sell signals with the cloud, you can then turn to the two unique moving averages provided by Ichimoku. The fast moving average is a 9 period moving average and the slow moving average is a 26 period moving average by default. What is unique about these moving averages is that unlike their western counterparts, the calculation is built on mid-prices as opposed to closing prices. I often refer to the fast moving average as the trigger line and the slow moving average as the base line.

In this video Manesh Patel shows you how to use Ichimoku clound system to project your entry and exit trading point.


