What is an Inside bar?
Inside bars are easily identified pricing patterns that can be found on virtually any chart. The pattern itself requires some simple technical analysis, which includes identifying a series of highs and lows on a daily chart. The idea is that the current candle on the graph will not exceed the previous candles high or low, thus leaving it “inside”.
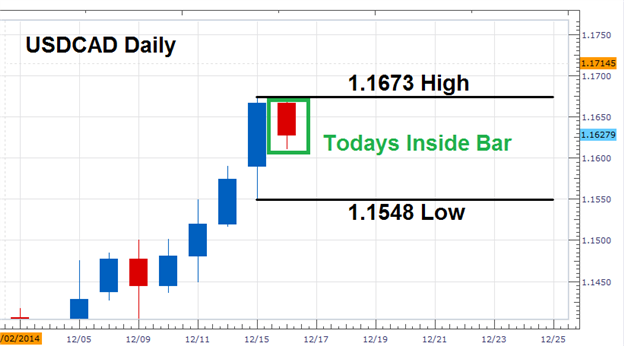
Let’s look at an example. Below we can see an example of an Inside Bar developing on a USDCAD Daily chart. Our analysis begins by pinpointing the previous bars high and low. Currently the high for the previous daily candle resides at 1.1673 while the low sits at 1.1548. It is important to remember both numbers as today’s price action should not exceed the denoted high or decline below the previous low.
Execution
So now that you have identified an inside bar, the next question is when and how to trade them. First off, trading inside bars lends itself to trading breakouts. The idea is that the identified highs and lows mentioned above, will also act as support and resistancevalues. If price breaks above resistance, traders will look to buy the market. Conversely if price falls below support, traders will look to sell.
Determining Risk and Reward
As the final step, setting stops and managing risk is one of the most important components of any working strategy. When it comes to trading inside bars, this process can be simplified by setting your stop between your orders. This means if your buy entry and sell entry are spaced 125 pips apart, as per our USDCAD example, you would set your risk at 62.5 pips.
Profit targets can also be formed in the same fashion. Traders opting to use a 1:2 Risk/Reward ratio can elect to target twice the amount of profit in pips relative to their risk. This means using the example above, a 125 pip profit target would be set.
Inside bars are easily identified pricing patterns that can be found on virtually any chart. The pattern itself requires some simple technical analysis, which includes identifying a series of highs and lows on a daily chart. The idea is that the current candle on the graph will not exceed the previous candles high or low, thus leaving it “inside”.
Let’s look at an example. Below we can see an example of an Inside Bar developing on a USDCAD Daily chart. Our analysis begins by pinpointing the previous bars high and low. Currently the high for the previous daily candle resides at 1.1673 while the low sits at 1.1548. It is important to remember both numbers as today’s price action should not exceed the denoted high or decline below the previous low.

Execution
So now that you have identified an inside bar, the next question is when and how to trade them. First off, trading inside bars lends itself to trading breakouts. The idea is that the identified highs and lows mentioned above, will also act as support and resistancevalues. If price breaks above resistance, traders will look to buy the market. Conversely if price falls below support, traders will look to sell.

Determining Risk and Reward
As the final step, setting stops and managing risk is one of the most important components of any working strategy. When it comes to trading inside bars, this process can be simplified by setting your stop between your orders. This means if your buy entry and sell entry are spaced 125 pips apart, as per our USDCAD example, you would set your risk at 62.5 pips.
Profit targets can also be formed in the same fashion. Traders opting to use a 1:2 Risk/Reward ratio can elect to target twice the amount of profit in pips relative to their risk. This means using the example above, a 125 pip profit target would be set.


