TRADING MANUAL - Bollinger Bandwidth Indicator, How To Use and Free To Download
Developed by John Bollinger.
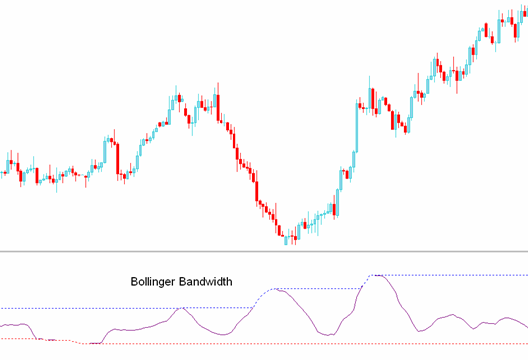
Bollinger Bandwidth indicator is derived from the original Bollinger indicator. Bandwidth is a measure of the width of the Bollingers.

Bollinger Bandwidth Indicator
This is an oscillator indicator, based on the theory that price and volatility occurs in cycles. Periods of high volatility is followed by periods of low volatility.
- When volatility is high, bands are far apart, the bandwidth will also be wide apart.
- When volatility is low, Bands are narrow and the bandwidth indicator will also not be narrow.
The blue line represents the highest Bandwidth value for a previous number of periods. This line also identifies periods of high volatility.
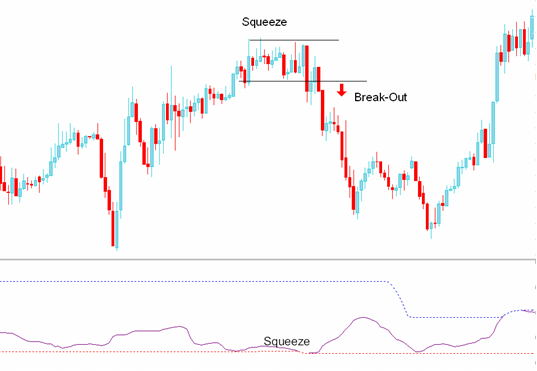
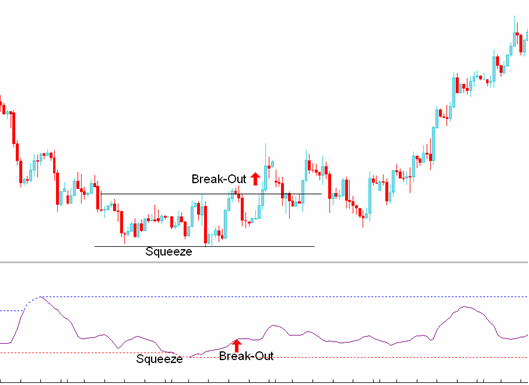
The red line represents the lowest Bandwidth value for a previous number of periods. This line also identifies periods of low volatility (Bollinger Squeeze).
Technical Analysis of Bollinger Bandwidth indicator
Consolidation - Bollinger Squeeze
Bollinger Bandwidth is used to identify the Bollinger squeeze, which is a consolidation period of price, after which the price then breaks out in a particular direction.
Signals are generated when there is a price breakout indicated by the indicator starting to go up after touching the red line. When the bandwidth line starts to move up it signifies that volatility is rising as the price is breaking out.


However, the Bollinger Bandwidth is a directionless indicator and needs to be combined with another indicator such as the moving average to determine the direction of the trend/ Breakout.
Videos :
- The Right Way to Trade Bollinger Bands (As the inventor of Bollinger bands, analyst John Bollinger discusses some of the misconceptions about trading the bands and how using them on multiple time frames can be advantageous).
- Reversals with Bollinger Bands
- How to trade Extreme Bollinger Band Reversal in Forex
- How to Trade Bollinger Bands - Stocks, Futures, Forex
- How to trade Bollinger Bands in Forex
- Bollinger Bands and Forex
The Book :
Bollinger on Bollinger Bands Hardcover by John A. Bollinger
Over the past two decades, thousands of veteran traders have come to
view Bollinger Bands as the most representative**and reliable**tool for
assessing expected price action. Now, in the long-anticipated Bollinger
on Bollinger Bands, John Bollinger himself explains how to use this
extraordinary technique to effectively compare price and indicator
movements.
Traders can look to this techniques-oriented book for hundreds of valuable insights, including:
- Analysis of the primary indicators derived from Bollinger Bands %b and BandWidth
- How traders can use Bollinger Bands to work with instead of against commonly encountered trading patterns
- Strategic use of Bollinger Bands in short-, mid-, and long-term trading program
- Three trading systems based on Bollinger Bands
Free To Download:
Bollinger Bandwidth 1.0 for MetaTrader 5 - indicator for MetaTrader 5

