Hany Elleithy / Profil
- Information
|
10+ Jahre
Erfahrung
|
0
Produkte
|
0
Demoversionen
|
|
0
Jobs
|
0
Signale
|
0
Abonnenten
|
Freunde
Anfragen
Fügen Sie Freunde über ihre Profile oder über die Suche hinzu, und Sie können mit ihnen kommunizieren und ihre Aktivität auf der Webseite verfolgen.
Ausgehend
Hany Elleithy

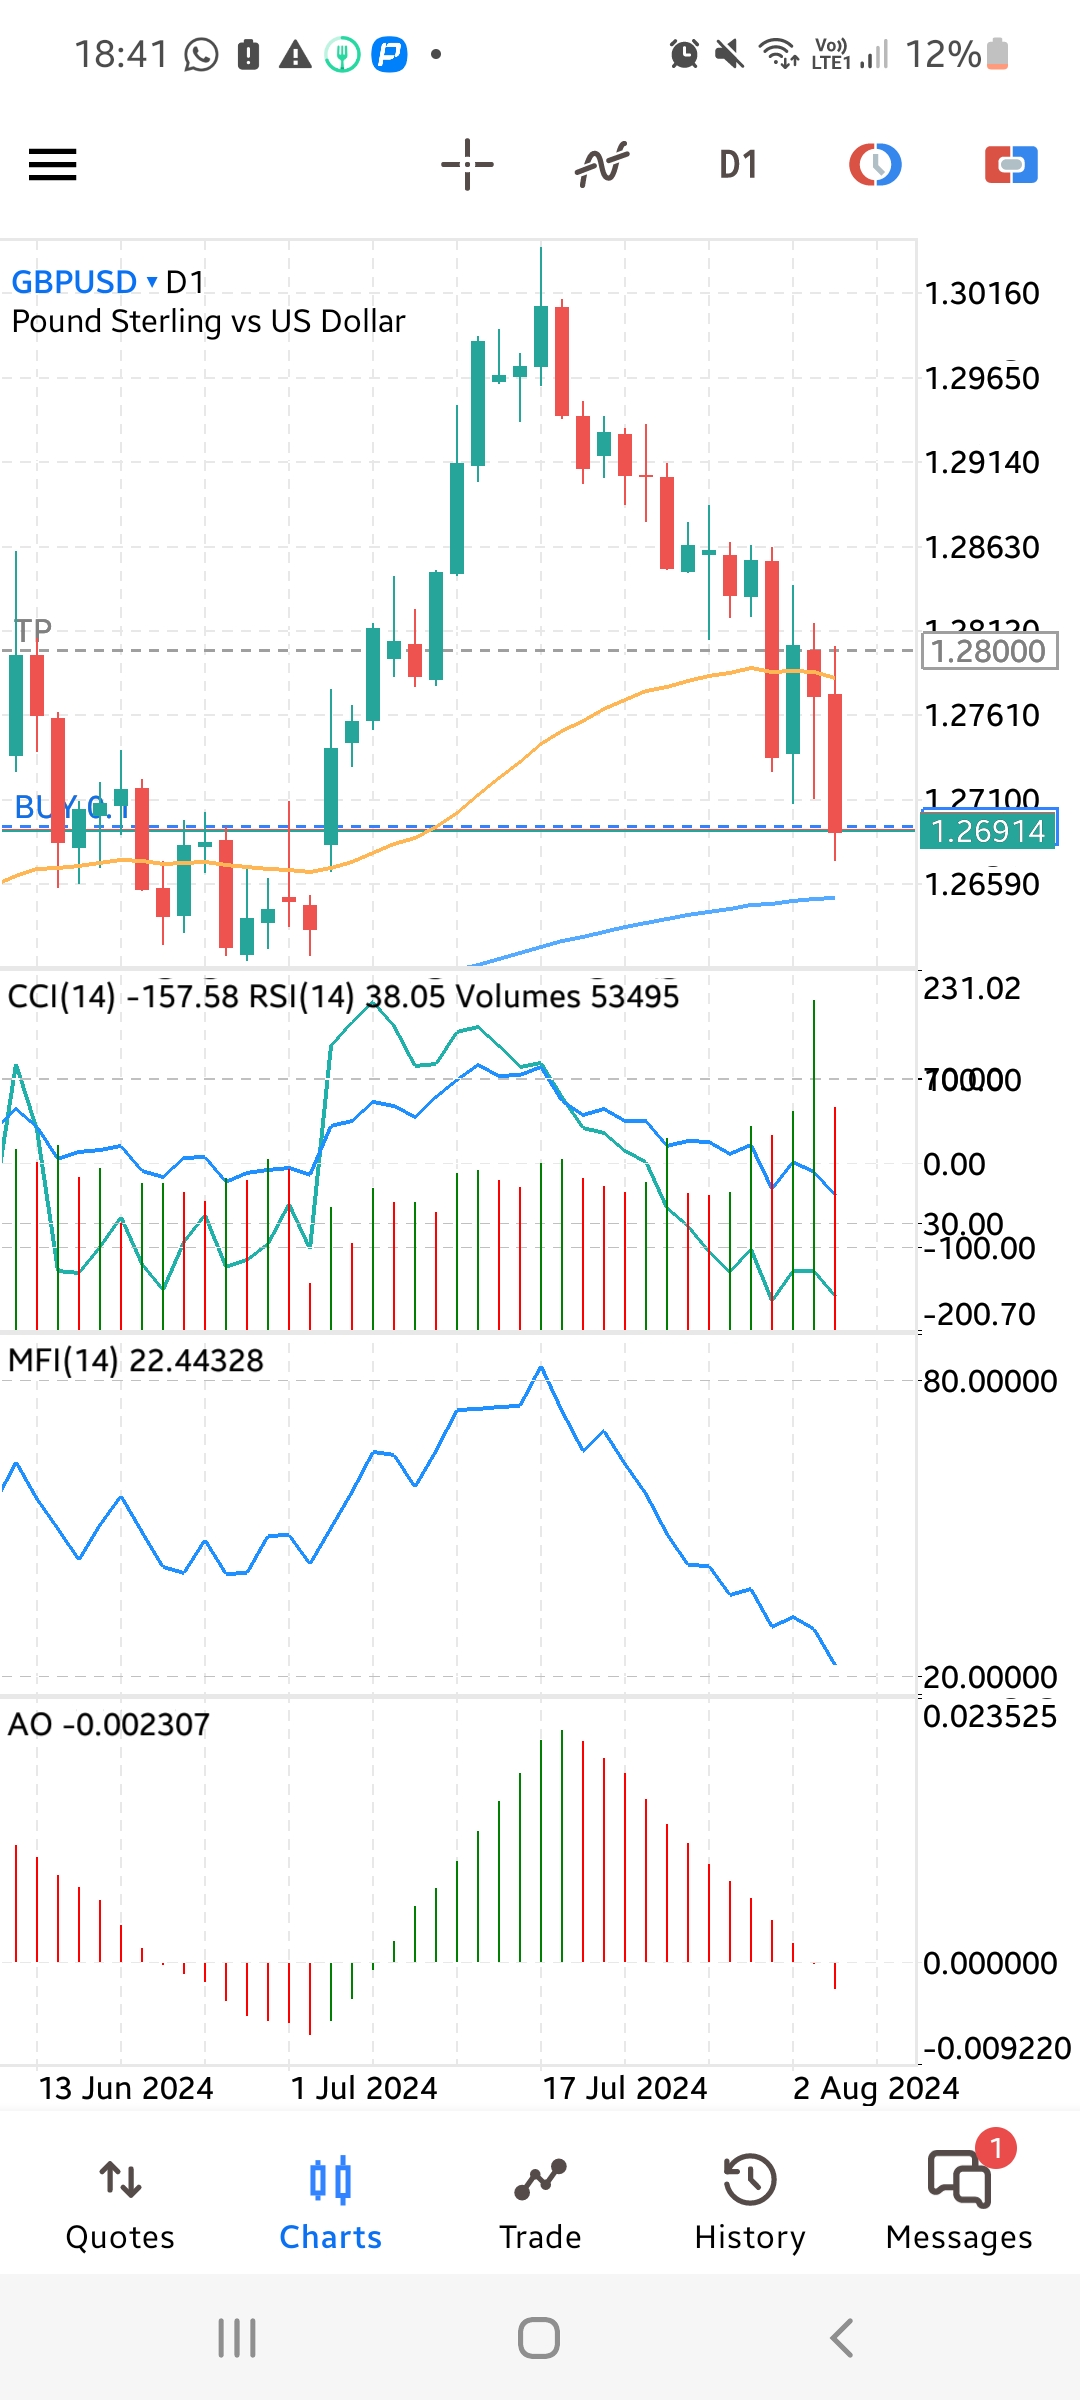
GBP/USD Daily Chart Trading Signal:
Signal: Buy
Entry: 1.26950 (Slightly above the current market price, anticipating a rebound)
Stop Loss: 1.26000 (Below the recent swing low)
Take Profit 1: 1.28000 (Near the 50-Day Moving Average and previous resistance level)
Take Profit 2: 1.29000 (Next resistance level)
Reasoning:
* Potential Trend Reversal: The price has been in a downtrend but shows signs of a potential reversal. It has recently bounced off a support level and is currently testing the 50-day moving average.
* Oversold Conditions: The CCI indicator is deeply in the oversold territory, suggesting that the current downward momentum may be exhausted.
* Bullish Divergence: The RSI indicator shows a bullish divergence, with higher lows while the price makes lower lows, indicating a potential bullish reversal.
* Positive Fundamental Outlook: Recent positive economic data from the UK and potential dovish signals from the US Federal Reserve could further support the GBP.
Risk Management:
This trade has a risk-to-reward ratio of approximately 1:2 for the first take profit and 1:4 for the second take profit. It's crucial to manage your risk by using a stop-loss order and adjusting your position size accordingly.
Disclaimer: This is a technical analysis-based trading signal and does not constitute financial advice. Always conduct your own research and consider multiple factors before making any trading decisions.
Additional Notes:
* Monitor price action closely, especially if it approaches the resistance levels. Consider taking partial profits at TP1 and adjusting your stop-loss to breakeven for the remaining position aiming for TP2.
* Be aware of upcoming economic news releases and central bank announcements, as they could significantly impact the GBP/USD pair.

Hany Elleithy

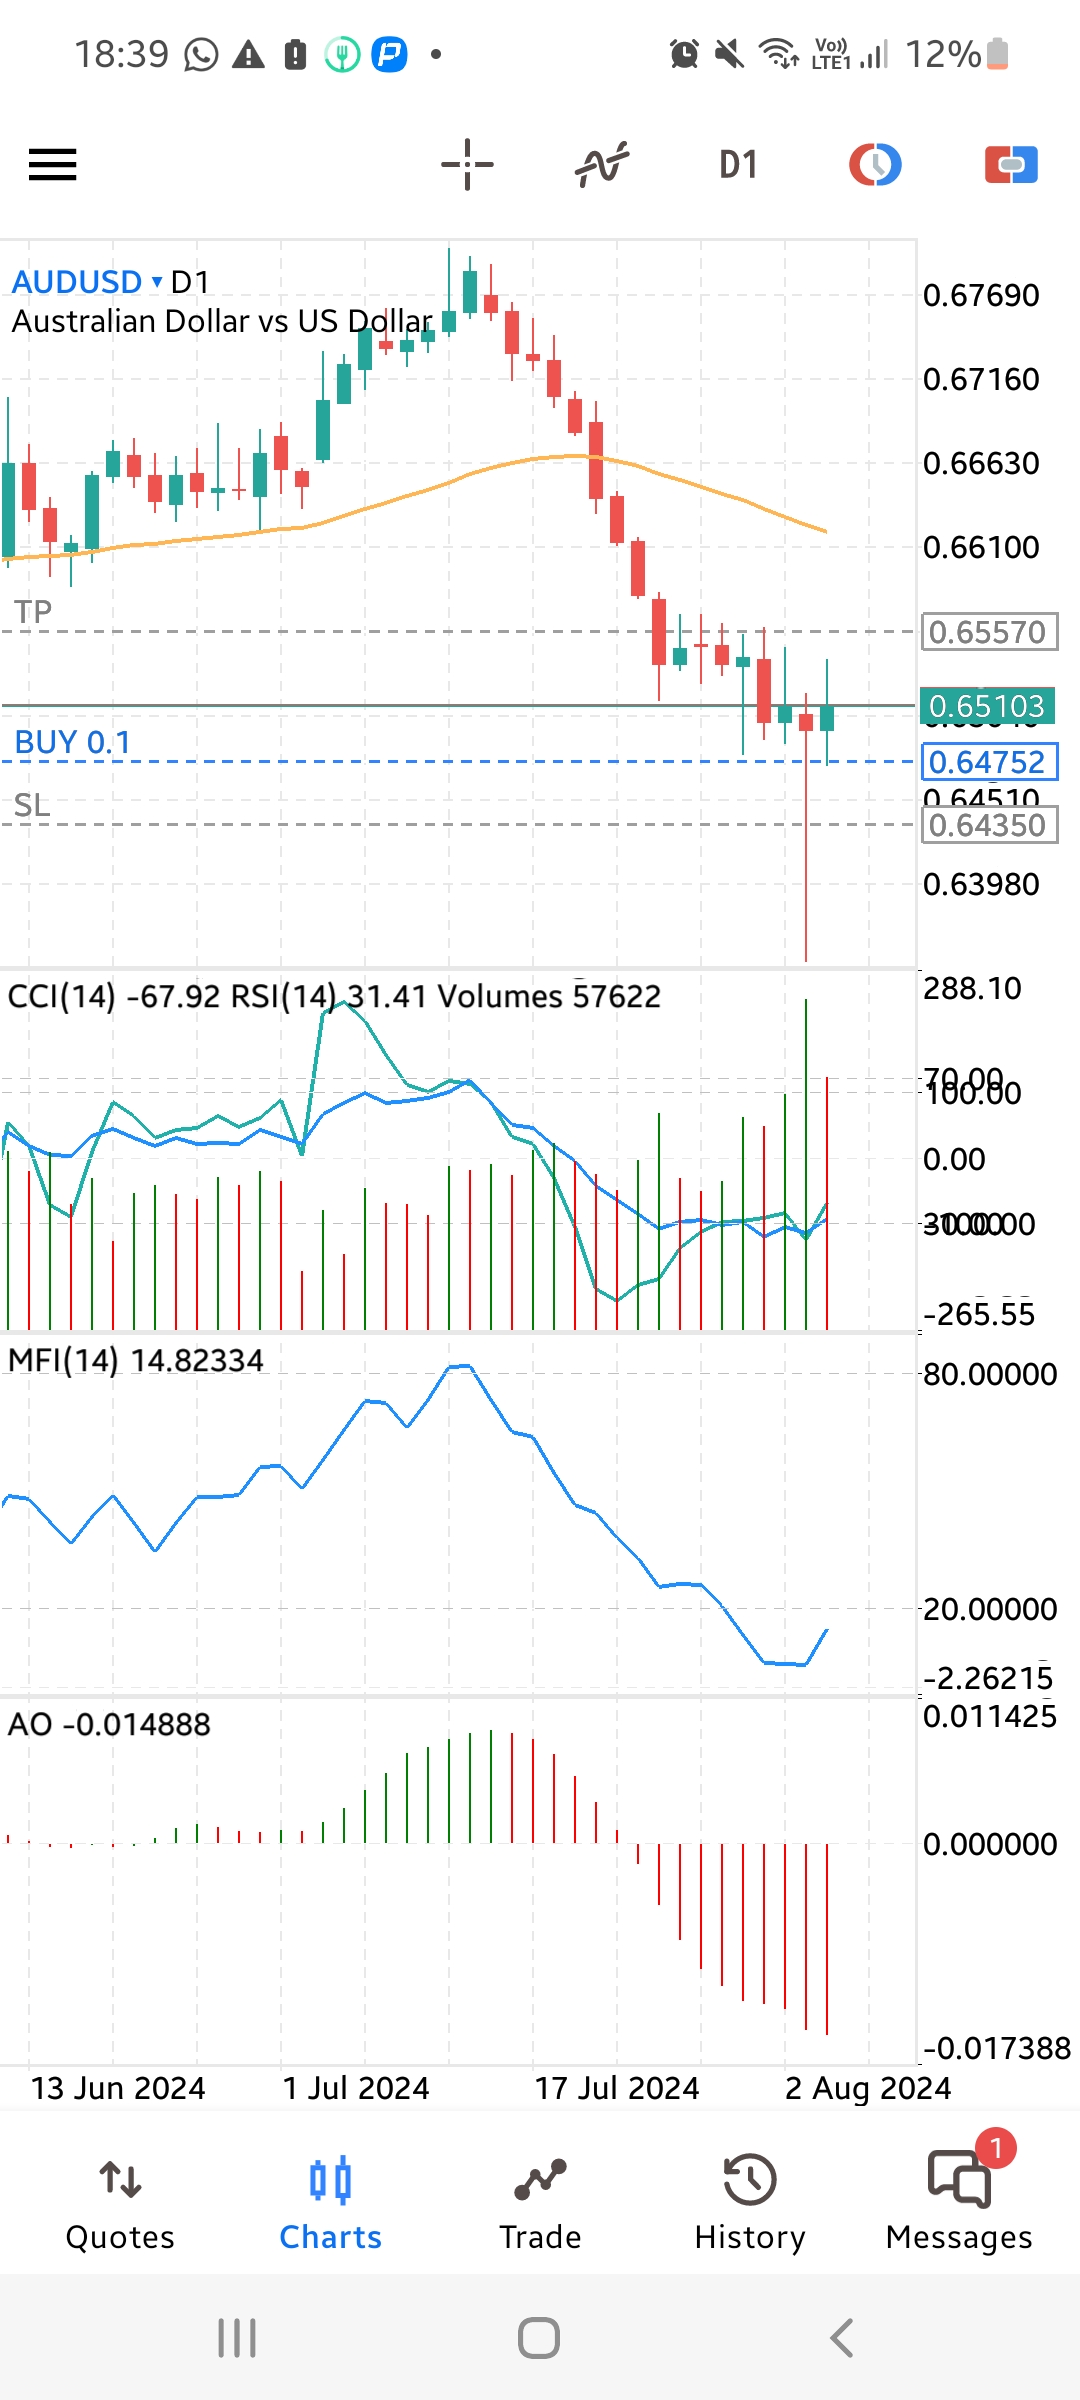
AUD/USD Daily Chart Trading Signal:
Signal: Buy
Entry: 0.64800 (Slightly above the current market price to allow for some pullback)
Stop Loss: 0.64350 (Below the recent swing low and support level)
Take Profit 1: 0.65570 (Near the 50-day moving average and recent resistance level)
Take Profit 2: 0.66100 (Next resistance level)
Reasoning:
* Potential Reversal: The price has been in a strong downtrend but is currently testing a key support level around 0.64500. The hammer candlestick pattern on Aug 6th, along with oversold conditions on CCI and RSI, suggest a potential trend reversal.
* Oversold Conditions: The CCI indicator is deeply in the oversold territory, indicating that the current downward momentum may be exhausted. The RSI is also at a low level, reinforcing the oversold condition.
* Bullish Divergence: While the price has been making lower lows, the CCI indicator has been making higher lows, indicating a potential bullish divergence.
Risk Management:
This trade has a risk-to-reward ratio of approximately 1:2.1 for the first take profit and 1:4.1 for the second take profit. It's crucial to manage your risk by using a stop-loss order and adjusting your position size accordingly.
Disclaimer: This is a technical analysis-based trading signal and does not constitute financial advice. Always conduct your own research and consider multiple factors before making any trading decisions.
Additional Notes:
* Monitor price action closely, especially if it approaches the resistance levels. Consider taking partial profits at TP1 and adjusting your stop-loss to breakeven for the remaining position aiming for TP2.
* Be aware of upcoming economic news releases and central bank announcements, particularly from Australia and the US, as they could significantly impact the AUD/USD pair.

: