Teresinha Moraes Correia / Verkäufer
Veröffentlichte Produkte

Description of Support and Resistance Indicator Based on Volume Profile for MetaTrader 4 Introduction The financial market is an arena where traders and investors constantly seek ways to gain a competitive edge. One of the most widely used and respected concepts in any market is support and resistance . These levels represent key price zones where supply and demand balance out, and where significant decisions are made by participants who drive the market. Our Support and Resistance Indicator wit

Ultimate Binary Options: The Best Indicator for Your Binary Options Trading If you're looking for a reliable, efficient, and powerful way to boost your results in binary options trading, Ultimate Binary Options is the perfect solution for you. This indicator was developed to provide traders with unparalleled accuracy, delivering success rates above 90% . But it's not just about numbers—it's about turning your strategies into consistently winning trades. What Makes Ultimate Binary Options S

In the fifth update , the indicator now aims to predict the direction of the next candle, issuing a buy or sell arrow precisely when the conditions are met.
Since its first version, which showed support and resistance levels on the chart, up to the current version 5, many improvements have been made. One of the key changes is the removal of visual support and resistance levels to prevent memory overload. This is no longer necessary, as arrows are now issued when the price is near or touches th

This updated version of the Value Chart indicator introduces new parameters in the way the indicator is calculated. Its main objective is to analyze the current range and attempt to predict the direction of the ongoing candle, displaying an arrow indicating where the candle is expected to move. The calculation structure is based on the last 1,000 candles. First, a weighted average is calculated for each candle. Then, the modified Value Chart calculation is applied to determine the range and str

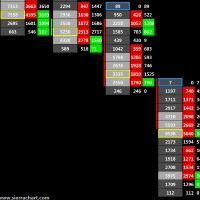
Volume Cluster Indicator for MetaTrader 4: Advanced Analysis of Support, Resistance, and Market Dynamics The Volume Cluster Indicator for MetaTrader 4 is a powerful tool designed for traders seeking an in-depth understanding of market dynamics. It provides detailed insights into volume behavior within each candlestick, highlighting levels where volume is "overpriced" and areas of weakness. This enables precise identification of support and resistance zones, making it indispensable for traders le

This custom indicator for MetaTrader 4 is a powerful tool designed to help traders of all experience levels identify clear trends in the financial market. It is built to provide precise visual support, eliminating the confusion and subjectivity often associated with chart analysis. Additionally, it ensures that you can stay in a profitable position throughout the entire duration of a trend, avoiding premature exits before the movement is fully realized. Identifying Clear Trends The foundation o