Smart Renko MT5
- Indikatoren
- Young Ho Seo
- Version: 6.5
- Aktualisiert: 3 März 2022
- Aktivierungen: 5
Introduction to Smart Renko
The main characteristics of Renko Charting concern price movement. To give you some idea on its working principle, Renko chart is constructed by placing a brick over or below when the price make the movement beyond a predefined range, called brick height. Therefore, naturally one can see clear price movement with less noise than other charting type. Renko charting can provide much clearer trend direction and it helps to identify important support and resistance level more clearly. As Renko charting does not use time, original Renko charting have some difficulties to be used together with other technical indicators. Especially backtesting of your strategy using typical Renko charting is very difficult and time consuming. However, we brought Smart Renko Chart here. Smart Renko overcomes the limitation of traditional Renko charting and it brings you many other benefits for your efficient trading.
Main Features of Smart Renko
- You can use any timeframe to calculate your Renko bricks including M1 and M5.
- Smart Renko will show you generally agreeable trend movement towards all timeframe.
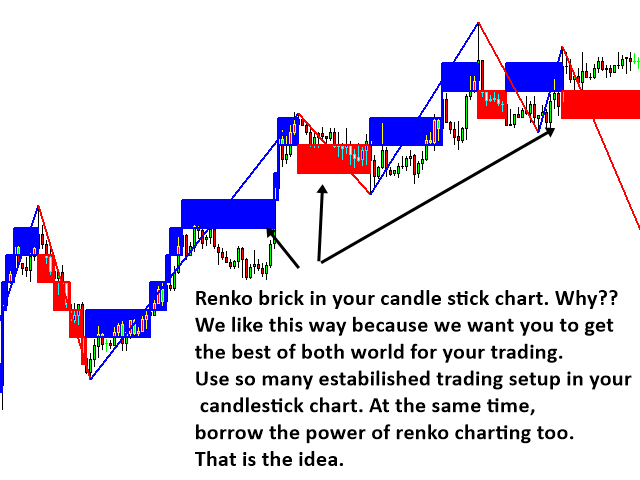
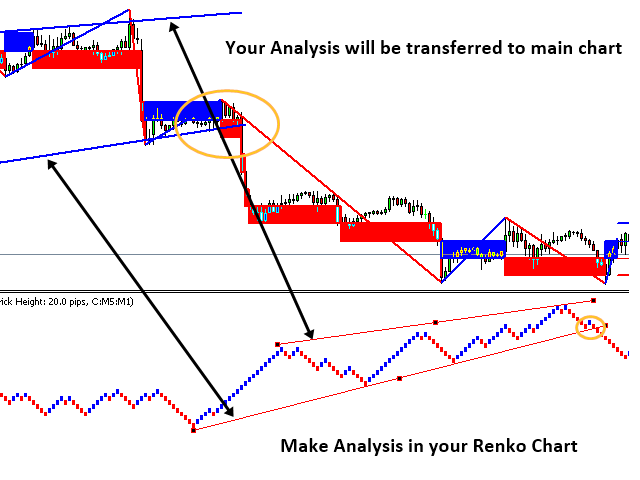
- You can display spread view of Renko bricks on your main chart allowing you to backtest with other technical indicators.
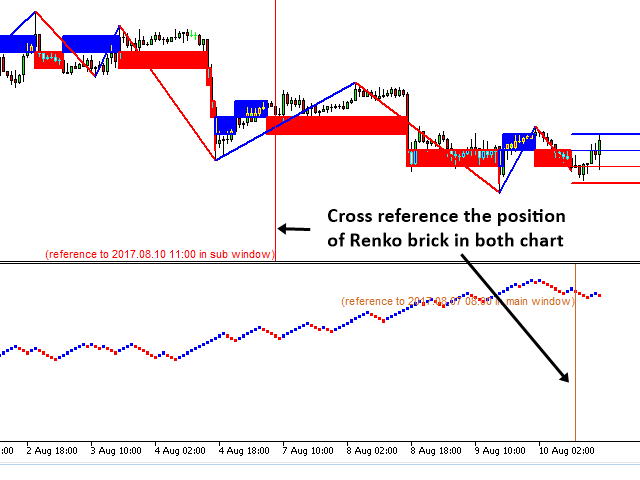
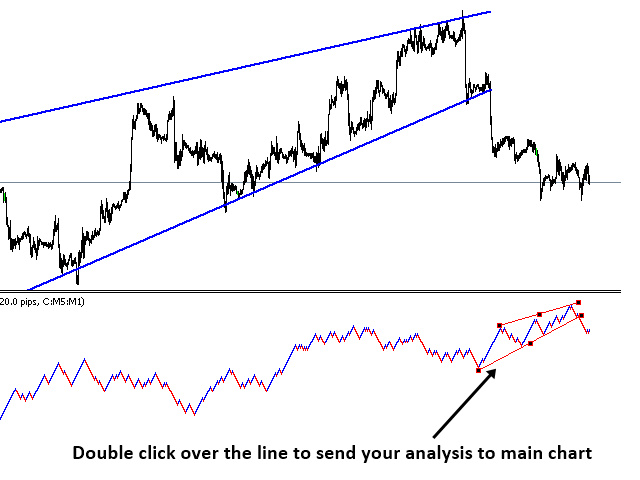
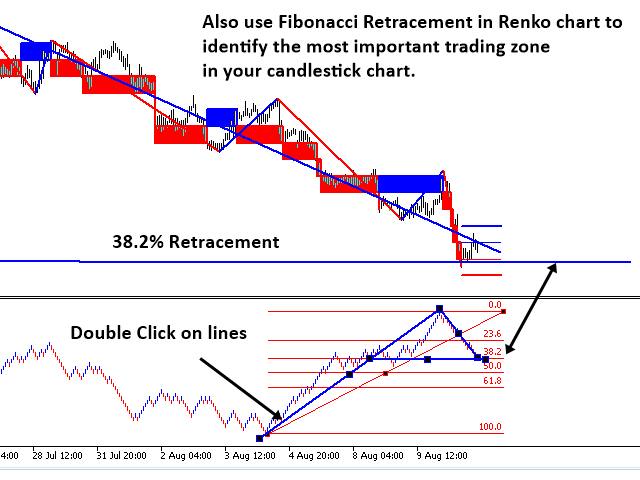
- You can cross reference between the Renko bricks on your main chart and Renko bricks on your indicator chart. (Simply just double click on your main chart or indicator chart. You will see reference lines on both charts.)
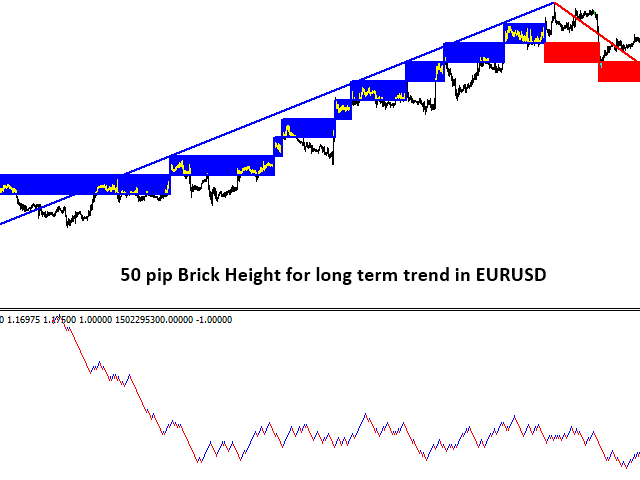
- Smart Renko includes automatic brick height calculation using Standard Deviation and Z value. Therefore even a starter can use this Smart Renko Indicator.
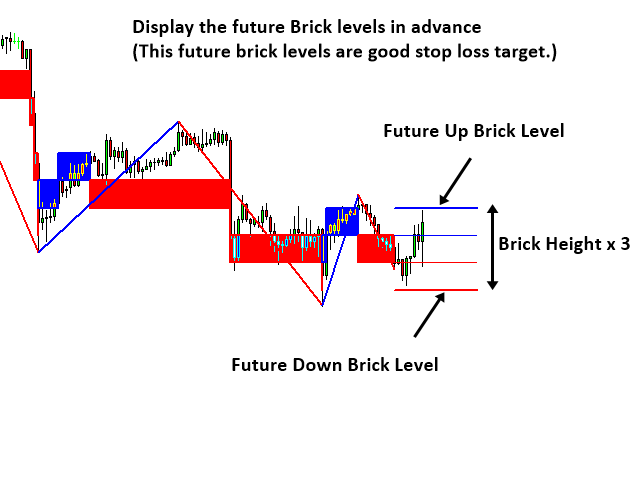
- Smart Renko will indicate the future brick level for buy and sell bricks in advance.
Some Note on Smart Renko
- Smart Renko must be used together with other indicator. You can use it with many built-in technical indicators successfully, such as MACD, RSI or Stoch, Moving Average to construct your trading strategy.
- Line chart is preferred with Smart Renko. Therefore, in default setting, Smart Renko uses line chart. However, you can always switch off the line chart and use candlestick chart.
- Renko chart should be calculated using M1 data. You can choose M1 timeframe for its calculation with Smart Renko. However, most brokers have short historical data for M1 timeframe. Therefore, default timeframe for calculation is M5 timeframe.
- It is possible to draw bricks on entire historical data. This may slow down your trading terminal.
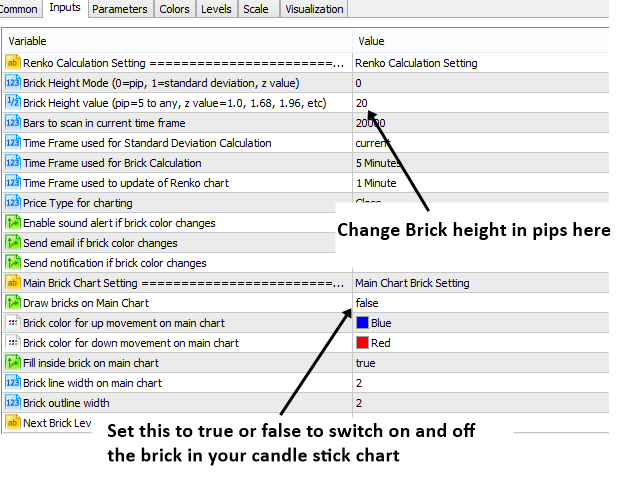
- For Brick Height Mode = 1, Smart Renko will use Standard deviation to calculate brick height automatically. Use the common Z value sensibly such as 1.0, 1.68, 1.96, etc. for profitable trading.
- For Brick Height Mode = 0, you can input any brick height in pips. Smart Renko will use your input to construct the Renko Chart.
- Hit R key on your keyboard When Smart Renko does not load automatically at start up. This happens due to initial data loading on sub-timeframe (M1, M5, etc.) of current timeframe.
- Smart Renko uses sub-timeframe (M1 or M5) for brick calculation and it displays bricks on the current timeframe. Do not use weekly or monthly chart. M1 or M5 timeframe mostly does not have sufficient data to draw Renko brick on weekly and monthly chart.
Trading Strategy Guide
You can use Smart Renko together with any of following technical analysis.
Guide for Volume Spread Analysis
Guide for Harmonic Pattern Detection Indicator
Guide for Supply Demand Indicator
Guide for Triangle Pattern, Falling Wedge Pattern, Rising Wedge Pattern and Channel
Guide for Elliott Wave Indicator
Important Note
This is the off the shelf product. Therefore, we do not accept any modification or customization request on this product. In addition, we do not provide any code library or any support for your coding for this product.