• Übersicht
  • Bewertungen
  • Diskussion
  • Neue Funktionen

SATL Candles 2 AM

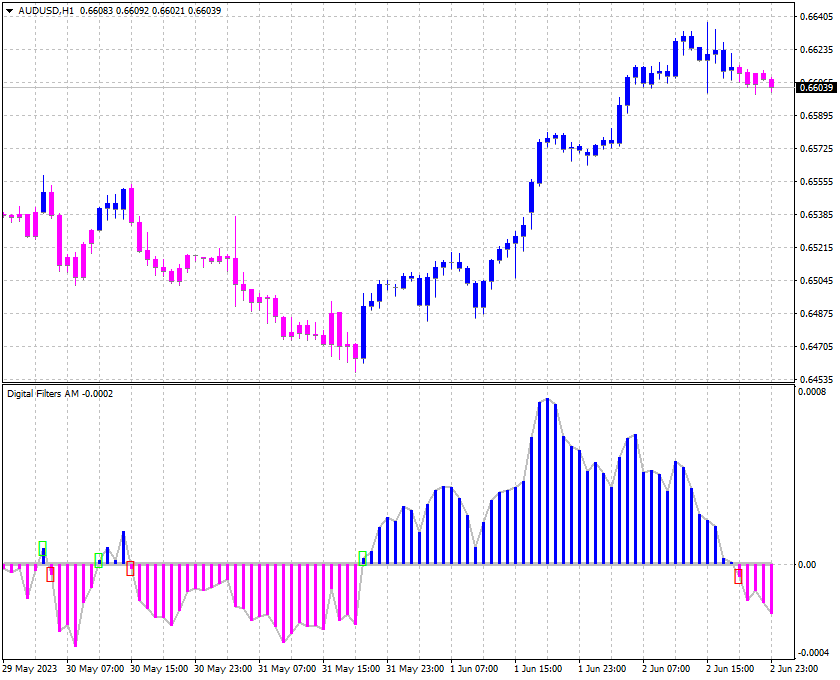
This indicator displays candle prices on the chart, colored in accordance with the data of the SATL digital filter built on closing prices.

The indicator has no configurable parameters.

Allows you to effectively follow a long-term trend.

Usage:

  • After the full formation of a candle colored in the opposite color to the previous candle, place a stop order at the high / low of such a candle.
  • When the price overcomes such a high/low, a position will be opened.
  • With the full formation of a candle painted in the opposite color, you should consider options for exiting the position or placing a stop order to close the position at the high / low of such a candle.


Empfohlene Produkte
FATL Candles 2 AM
Andriy Matviyevs'kyy
This indicator displays candle prices on the chart, colored in accordance with the data of the FATL digital filter built on closing prices. The indicator has no configurable parameters. Allows you to effectively follow the short-term trend. Usage: After the full formation of a candle colored in the opposite color to the previous candle, place a stop order at the high / low of such a candle. When the price overcomes such a high/low, a position will be opened. With the full formation of a candle p
T3 Heiken Ashi AM
Andriy Matviyevs'kyy
Implementation of the classic Heiken Ashi indicator using the T3 smoothing method. The indicator allows you to select the smoothing depth and the smoothing shift relative to the current price. The indicator also allows you to select the price at which the data will be smoothed, as well as the control price with which comparison is made. The proposed approach allows you to visualize the trend and simplify trading decisions.
Are you tired of drawing trendlines every time you're analyzing charts? Or perhaps you would like more consistency in your technical analysis. Then this is for you. This indicator will draw trend lines automatically when dropped on a chart. How it works Works similar to standard deviation channel found on mt4 and mt5. It has 2 parameters: 1. Starting Bar 2. Number of bars for calculation The   starting bar   is the bar which drawing of the trend lines will begin, while the   number of bars for c
FREE
Rainbow MT4
Jamal El Alama
Rainbow MT4 is a technical indicator based on Moving average with period 34 and very easy to use. When price crosses above MA and MA changes color to green, it’s a signal to buy. When price crosses below MA and MA changes color to red, it’s a signal to sell. The Expert advisor ( Rainbow EA MT4) based on Rainbow MT4 indicator, as you can see in the short video below is now available here .
FREE
Market Profile 3
Hussien Abdeltwab Hussien Ryad
1 (1)
Market Profile 3 MetaTrader 4 indicator  — is a classic Market Profile implementation that can show the price density over time, outlining the most important price levels, value area, and control value of a given trading session. This indicator can be attached to timeframes between M1 and D1 and will show the Market Profile for daily, weekly, monthly, or even intraday sessions. Lower timeframes offer higher precision. Higher timeframes are recommended for better visibility. It is also possible t
FREE
TrendPlus
Sivakumar Subbaiya
4 (11)
Trend Plus   Trendplus  Indicator   Time Frame: Suitable for any time frame.  Purpose: Trend Prediction. Blue and red candle indicate the buy and sell call respectively. Buy: When the blue candle is formed buy call is initiated. close the buy trades when the next red candle will formed.   Sell: When the Red candle is formed Sell call is initiated. close the Sell trades when the next blue candle will formed.   Happy trade!!
FREE
OrderBlock TS Roman
Vladislav Vlastovskii
3.5 (4)
Индикатор строит блоки заказов (БЗ) по торговой системе (ТС) Романа. Поиск блоков осуществляется одновременно на двух таймфремах: текущем и старшем (определяемым в настройках). Для оптимизации и игнорирования устаревших блоков в настройках задается ограничение количества дней в пределах которых осуществляется поиск блоков. Блоки строятся по правилам ТС состоящем из трех шагов: какую свечу вынесли (что?); какой свечой вынесли (чем?); правило отрисовки (как?).
FREE
The   VWAP indicator   is our version of the popular Volume-Weighted Average Price indicator. The VWAP is the ratio between the value traded (price multiplied by the number of volume traded) and the total volume traded over a specific time period. As a result, it measures the average price of the instrument much better than the simple moving average. Although there are many ways to use the VWAP, most investors use it to calculate the daily average.  The indicator works in five modes: Moving  
This indicator alerts you when/before new 1 or 5 minute bar candle formed. In other words,this indicator alerts you every 1/5 minutes. This indicator is especially useful for traders who trade when new bars formed. *This indicator don't work propery in strategy tester.Use this in live trading to check functionality. There is more powerful Pro version .In Pro version,you can choose more timeframe and so on. Input Parameters Alert_Or_Sound =Sound ----- Choose alert or sound or both to not
FREE
Features: 1- Get OB/OS Levels from Golden MA Levels 2- Wait for Buy/Sell Start Level Cross 3- Optional: Should price cross Mid Level in earlier bars 4- Optional: Crossing bar High/Medium Volume 5- Optional: MA Stacked to check up/down trend for current TF 6- Optional: NRTR higher timeframes aligned Check Detailed blog post explained: https://www.mql5.com/en/blogs/post/758457 Levels with Buffers available here: Golden MA Levels Indicator: https://www.mql5.com/en/market/product/119515
FREE
Anchored VWAP with Alert
Trade The Volume Waves Single Member P.C.
5 (4)
What is the Volume Weighted Average Price (VWAP)? The volume weighted average price (VWAP) is a trading benchmark used by traders that gives the average price an instrument has traded at throughout the day, based on both volume and price.  It is important because it provides traders with insight into both the trend and value of the instrument. What is the Difference between VWAP and AVWAP? While VWAP is having as starting point the beggining of the day,week,month etc. in the AVWAP you can pla
QuantumAlert RSI Navigator is a free indicator available for MT4/MT5 platforms, its work is to provide "alerts" when the market is inside "overbought and oversold" regions in the form of "buy or sell" signals. This indicator comes with many customization options mentioned in the parameter section below, user can customise these parameters as needful. Join our   MQL5 group , where we share important news and updates. You are also welcome to join our private channel as well, contact me for the pri
FREE
Traditional MACD MT4
Daniel Lewis
4.56 (50)
MACD indicator in MetaTrader 4/5 looks different than MACD does in most other charting software. That is because the MetaTrader 4/5 version of MACD displays the MACD line as a histogram when it is traditionally displayed as a line. Additionally, the MetaTrader 4/5 version computes the Signal line using an SMA, while according to MACD definition it is supposed to be an EMA. The MetaTrader 4/5 version also does not compute a true MACD Histogram (the difference between the MACD/Signal lines). This
FREE
MASi Three Screens
Aleksey Terentev
5 (2)
MASi Three Screens is based on the trading strategy by Dr. Alexander Elder. This indicator is a collection of algorithms. Algorithms are based on the analysis of charts of several timeframes. You can apply any of the provided algorithms. List of versions of algorithms:     ThreeScreens v1.0 - A simple implementation, with analysis of the MACD line;     ThreeScreens v1.1 - A simple implementation, with analysis of the MACD histogram;     ThreeScreens v1.2 - Combines the first two algorithms
FREE
Forex Indicator  " ATR Trailing Stop"  for MT4 Upgrade   your trading methods with great auxiliary ATR Trailing Stop  indicator for MT4. This indicator is perfect for     Trailing Stop purpose ATR Trailing Stop   is  automatically adaptive   to market volatility No delays and easy set up This indicator is excellent to combine with price action entries into the direction of main trend // More great Expert Advisors and Indicators are available here:  https://www.mql5.com/en/users/def1380/seller It
Magic Filter MTF is perfect for any strategy. you do not need to load the chart with extra indicators like this one indicator will replace all additional filters for you it can also be a great strategy. it combines well with trading at local minima and maximums (resistance levels) multi-timeframe-multi-currency indicator 4 screen system is used 4 rows of arrows UTB indicators adjusted for different periods when two arrows pointing in the same direction on the same timeframe coincide
Forex Gump Dot is a ready-made mechanical trading system for the +10 pips strategy. This strategy has been actively discussed and developed on the Internet for several years. The essence of this strategy is to open trade operations during the day and fix the minimum profit on each trade operation. That is, scalp. Our development team decided to adapt the indicators of the Forex Gump family and release a new product that will best match the scalping trading strategy. This product is Forex Gump Do
The   Volume Weighted ATR indicator   is a helpful tool for measuring market activity. It is based on the idea of the Volume-Weighted ATR. Combining these two elements helps identify potential turning points or breakout opportunities. The indicator for the classification of the activity of the market uses the moving average and its multiples. Accordingly, where the VWATR bar is located (relative to the moving average), it is labelled as ultra-low, low, average, high, very high or ultra high. Th
FREE
Der Indikator ermöglicht es Ihnen, die aktuelle Kursrichtung und Marktvolatilität zu bestimmen. Diese Version des Traders Dynamic Index hat das Neuzeichnen der historischen Daten eliminiert, die Berechnungsgeschwindigkeit des Algorithmus optimiert, mehr externe Parameter für eine genauere Anpassung und seine Funktionalitäten erweitert: die Auswahl des anfänglichen Oszillators und die Glättungsmethoden der Durchschnitte hinzugefügt . Parameter: Mode Osc - Auswahl des Schätzoszillators Period Osc
Lisek Weis Wave
Darius Hans Lischka
5 (3)
This Weis Wave Volume indicator is a tool to help traders identify the current price trend.  Understanding volume can provide insight into a market's behavior to help you determine its overall health. The most important rule is this: volume precedes price. Typically, before a market price moves, volume comes into play. It has 2 main colors histogram which are green and red. – Green indicates an upward wave. The more the price increases, the bigger the green volume gets. – The red color shows a d
FREE
CyberZingFx Trend Reversal
Afsal Meerankutty
4.07 (14)
Indicator captures the trend reversals with no-repaint Buy and Sell Arrow signals. CyberZingFx Trend Reversal Indicator - your go-to solution for accurate and reliable trend reversal signals. With its  advanced trading strategy , the indicator offers you Buy and Sell Arrow signals that do not repaint, making it a reliable tool for catching Swing Highs and Swing Lows in any market and any time frame. Indicator works on  any market  and  any time frames . __________________________________________
Multi Timeframe ZigZag Indicator
Salman A A A T Bakhash
5 (2)
Description: This indicator draw ZigZag Line in multiple time frame also search for Harmonic patterns before completion of the pattern. Features: Five instances of ZigZag indicators can be configured to any desired timeframe and inputs. Draw Harmonic pattern before pattern completion. Display Fibonacci retracement ratios. Configurable Fibonacci retracement ratios. Draw AB=CD based on Fibonacci retracement you define. You can define margin of error allowed in Harmonic or Fibonacci calculatio
FREE
MegaTrends
Sivakumar Subbaiya
1 (1)
Megatrends  Indicator   Time Frame: Suitable for any time frame.  Purpose: Trend Prediction. Blue and red color indicate the buy and sell call respectively. Buy: When the blue line is originating it is opened buy call. Sell: When the Red line is origination it is opened sell call Happy trade!! this indicator is suitable for all time frame, but our recommended time frame to use 1hour and 4 hours, suitable for any chart.
FREE
Индикатор реализован для определения классического канала движения цены, который используется на крупных биржевых площадках. Не перерисовывается Синий уровень - это уровень поддержки  Красный уровень - это уровень сопротивления  Белый уровень - является Pivot-уровнем  Настройки Period_SEC  - ввод  значения периода . Примечание:  Индикатор определяет уровни только на пятизначных котировках! Метод торговли:  Открытие позиций осуществляется от уровней , именно на их значениях происходит отскок цены
FREE
Trend Strength Meter
Sukunthakan Ngernbamrung
Simple Trading System Update !!! Follow this link to see our 2024 Strategy !!!   ( Download the EAs scanner ) INTRODUCTION : The strength meter is an trading tool that is used to identify trending and consolidating markets based on the percentage rate.  HOW TO USE IT : You can use this indicator with Deal Trading Trend >> Click Here << To use this trading tool to identify trending and consolidating markets (the most important part)
FREE
Pivot Points MT4
KEENBASE SOFTWARE SOLUTIONS
KT Pivot Points automatically plots the daily, weekly, and monthly pivot levels on a chart with the precise calculation based on the latest data. Pivot points is a widely used indicator in technical analysis, particularly in the Forex market. Features Send alerts when the price touches the pivot level.  It offers complete customization for each kind of pivot level.   Shows daily, weekly, and monthly pivot levels without any fuss. It uses minimum CPU resources for faster calculation. Compati
The indicator allows you to trade binary options. The recommended time frame is М1 and the expiration time is 1,2,3 minutes. The indicator suitable for auto and manual trading. A possible signal is specified as a arrows above/under a candle. You should wait until the candle closes! Arrows are not re-painted Trade sessions: TOKYO section (Half-end) Currency pairs: USD/JPY Working time frame: M1 Expiration time: 1,2,3 minutes. The indicator also shows good results when using the martingale strateg
FREE
Classic Fractals indicator for MT4, with additional Trendlines connecting the latest couples of fractals ( fractals are showing highest high, and lowest low on each period) Rules for trendlines: -if new top fractal is below the last one = new resistance line -if new bot fractal is above the last one = new support line -Trendlines can be hidden -Fractals can be hidden Fractal Period = can be both even or uneven number, as it is setting for half (one side) of the bars sequence
Trade History Drawer
David Leander Tschacher
Trade History Drawer ist ein Indikator für MetaTrader 4. Es werden Trades in benutzerdefinierten Farben auf den Chart gezeichnet. Ausserdem erstellt der Indikator eine Trade-History-Zusammenfassung und speichert sie in einem CSV-File ab; Für das selektierte Symbol oder für alle Symbole. Eingaben General Settings Number Trades : Anzahl der Trades die gezeichnet werden sollen, falls -1 alle Magic Number : Nur Trades mit dieser MagicNumber, falls -1 wird diese Eingabe ignoriert Line Style : Ar
Update:ver1.53 (2023/08/16) ・ Overview and required environment Generate a duplicate limit order reservation for manual orders or orders from other tools, etc. This is specialized to "simplify the ordering operation". For the analysis to decide ordering, please do your best by yourself, such as fishing for materials, deriving a rule of thumb, using other analysis tools and EA together, etc. Since version 1.28, the function of "automatically re-order after settlement" has been implemented. (This
FREE
Käufer dieses Produkts erwarben auch
Gann Made Easy
Oleg Rodin
4.84 (58)
Gann Made Easy ist ein professionelles und einfach zu bedienendes Forex-Handelssystem, das auf den besten Handelsprinzipien unter Verwendung der Theorie von Mr. basiert. W.D. Gann. Der Indikator liefert genaue KAUF- und VERKAUFSsignale, einschließlich Stop-Loss- und Take-Profit-Levels. Mit PUSH-Benachrichtigungen können Sie auch unterwegs handeln. Bitte kontaktieren Sie mich nach dem Kauf! Ich werde meine Handelstipps und tolle Bonusindikatoren kostenlos mit Ihnen teilen! Wahrscheinlich haben Si
Atomic Analyst
Issam Kassas
5 (2)
Zunächst einmal ist es erwähnenswert, dass dieser Handelsindikator nicht neu malt, nicht neu zeichnet und keine Verzögerung aufweist, was ihn sowohl für manuellen als auch für Roboterhandel ideal macht. Benutzerhandbuch: Einstellungen, Eingaben und Strategie. Der Atom-Analyst ist ein PA-Preisaktionsindikator, der die Stärke und das Momentum des Preises nutzt, um einen besseren Vorteil auf dem Markt zu finden. Ausgestattet mit fortschrittlichen Filtern, die helfen, Rauschen und falsche Signale z
Trend Punch
Mohamed Hassan
5 (13)
This indicator is unstoppable when combined with our other indicator called  Support & Resistance . After purchase, send us a message and you will get it   for  FREE as a BONUS! Introducing Trend Punch , the revolutionary forex trend indicator that will transform the way you trade! Trend Punch is uniquely designed to provide precise buy and sell arrows during strong market trends, making your trading decisions clearer and more confident. Whether you're trading major currency pairs or exotic sym
TPSpro RFI Levels
Roman Podpora
4.8 (20)
Umkehr der ersten Impulsniveaus (RFI)       ANWEISUNGEN       Russland       -        ENG    Die Empfehlung basiert auf dem Indikator -   TPSpro   TREND PRO -   Version MT5 Die wichtigsten Elemente in der Branche sind entweder in Zonen oder in der Fabrik enthalten, oder sie führen zu einer Lösung bei einem Kauf oder dem Verkauf eines anderen Instruments. Wenn viele Menschen ihre Rechte nicht auf dem Händlerkonto verschlüsseln, werden die Folgen nicht schnell genug sein. Ich habe es damit abgesc
Gold Stuff
Vasiliy Strukov
4.89 (202)
Gold Stuff-Ein Trendindikator, der speziell für Gold entwickelt wurde, kann auch auf allen Finanzinstrumenten verwendet werden. Der Indikator wird nicht neu gezeichnet und verzögert sich nicht. Empfohlener Zeitrahmen H1. Nach diesem Indikator geschrieben EA Gold Stuff Berater, können Sie es in meinem Profil finden. WICHTIG! Kontaktieren Sie mich sofort nach dem Kauf, um Anweisungen und Bonus zu erhalten!   Sie können eine kostenlose Kopie unseres Strong Support- und Trendscanner-Indikators
Scalper Inside PRO
Alexey Minkov
4.69 (49)
An exclusive indicator that utilizes an innovative algorithm to swiftly and accurately determine the market trend. The indicator automatically calculates opening, closing, and profit levels, providing detailed trading statistics. With these features, you can choose the most appropriate trading instrument for the current market conditions. Additionally, you can easily integrate your own arrow indicators into Scalper Inside Pro to quickly evaluate their statistics and profitability. Scalper Inside
FX Power MT4 NG
Daniel Stein
5 (12)
Erhalten Sie Ihr tägliches Marktupdate mit Details und Screenshots über unser Morning Briefing hier auf mql5 und auf Telegram ! FX Power MT4 NG ist die nächste Generation unseres langjährig sehr beliebten Währungsstärkemessers FX Power. Und was bietet dieser Stärkezähler der nächsten Generation? Alles, was Sie am ursprünglichen FX Power geliebt haben PLUS GOLD/XAU-Stärkeanalyse Noch präzisere Berechnungsergebnisse Individuell konfigurierbare Analysezeiträume Anpassbares Berechnungslimit für noc
TPSproTREND PrO
Roman Podpora
4.79 (19)
TPSpro TREND PRO   ist ein Trendindikator, der den Markt automatisch analysiert und Informationen über den Trend und jede seiner Änderungen liefert sowie Signale für den Einstieg in Geschäfte ohne Neuzeichnung gibt! Der Indikator verwendet jede Kerze und analysiert sie separat. bezieht sich auf verschiedene Impulse – Aufwärts- oder Abwärtsimpuls. Exakte Einstiegspunkte in Transaktionen für Währungen, Krypto, Metalle, Aktien, Indizes! Version MT5                   VOLLSTÄNDIGE BESCHREIBUNG DES
Trend Pulse
Mohamed Hassan
5 (2)
Please contact me after purchase to immediately get your PDF strategy + documentation for Trend Pulse !  Official release price of $89  (3 /50 copies left). Next price is $199 . Introducing Trend Pulse , a unique and robust indicator capable of detecting bullish, bearish, and even ranging trends! Trend Pulse uses a special algorithm to filter out market noise with real precision. If the current symbol is moving sideways, Trend Pulse will send you a ranging signal, letting you know that it'
Zunächst einmal ist es wichtig zu betonen, dass dieses Handelstool ein Nicht-Repaint-, Nicht-Redraw- und Nicht-Verzögerungsindikator ist, was es ideal für professionelles Trading macht. Online-Kurs, Benutzerhandbuch und Demo. Der Smart Price Action Concepts Indikator ist ein sehr leistungsstarkes Werkzeug sowohl für neue als auch erfahrene Händler. Er vereint mehr als 20 nützliche Indikatoren in einem und kombiniert fortgeschrittene Handelsideen wie die Analyse des Inner Circle Traders und Stra
DERZEIT 26% RABATT Die beste Lösung für jeden Newbie oder Expert Trader! Dieser Indikator ist ein einzigartiges, qualitativ hochwertiges und erschwingliches Trading-Tool, da wir eine Reihe von proprietären Funktionen und eine neue Formel integriert haben. Mit nur EINEM Chart können Sie die Währungsstärke für 28 Forex-Paare ablesen! Stellen Sie sich vor, wie sich Ihr Handel verbessern wird, weil Sie in der Lage sind, den genauen Auslösungspunkt eines neuen Trends oder einer Scalping-Gelegenh
Wir stellen vor       Quantum Trend Sniper Indicator   , der bahnbrechende MQL5-Indikator, der die Art und Weise, wie Sie Trendumkehrungen erkennen und handeln, verändert! Entwickelt von einem Team erfahrener Händler mit über 13 Jahren Handelserfahrung,       Quantum Trend Sniper-Indikator       wurde entwickelt, um Ihre Trading-Reise mit seiner innovativen Methode zur Identifizierung von Trendumkehrungen mit extrem hoher Genauigkeit auf ein neues Niveau zu heben. ***Kaufe Quantum Trend Snipe
Currency Strength Wizard ist ein sehr leistungsstarker Indikator, der Ihnen eine Komplettlösung für erfolgreichen Handel bietet. Der Indikator berechnet die Stärke dieses oder jenes Forex-Paares anhand der Daten aller Währungen in mehreren Zeitrahmen. Diese Daten werden in Form von benutzerfreundlichen Währungsindizes und Währungsstärkelinien dargestellt, anhand derer Sie die Stärke dieser oder jener Währung erkennen können. Sie müssen lediglich den Indikator an das Diagramm anhängen, mit dem Si
Derzeit 20% Rabatt! Die beste Lösung für jeden Neueinsteiger oder Expert Händler! Dieses Dashboard arbeitet mit 28 Währungspaaren. Es basiert auf 2 unserer Hauptindikatoren (Advanced Currency Strength 28 und Advanced Currency Impulse). Es bietet einen hervorragenden Überblick über den gesamten Forex-Markt. Es zeigt die Werte der Advanced Currency Strength, die Veränderungsrate der Währungen und die Signale für 28 Devisenpaare in allen (9) Zeitrahmen. Stellen Sie sich vor, wie sich Ihr Hande
Bomb Bank Signal
Igor Pereira Calil
Bombenbanksignal: Ihr Vertrauensindikator in MetaTrader 4 Bomb Bank Signal ist ein leistungsstarker Indikator für MetaTrader 4, der entwickelt wurde, um die relevantesten Trends auf dem Finanzmarkt zu identifizieren. Wenn Sie nach einem Tool suchen, das Bewegungen genau vorhersieht, ist die Bomb Bank der Verbündete, den Sie brauchen. So funktioniert es: Dieser Indikator kombiniert drei unterschiedliche Methoden – Volumenanalyse, Kerzenschließungen und symmetrischer Trend –, um Kauf- und V
- Real price is 80$ - 40% Discount ( It is 49$ now ) Contact me for instruction, any questions! Related EA Product: Bitcoin Expert Introduction The breakout and retest strategy is traded support and resistance levels. it involves price breaking through a previous level.  The break and retest strategy is designed to help traders do two main things, the first is to avoid false breakouts. Many false breakouts start with a candlestick that breaks out of a level but ends with an immediate candlestic
DERZEIT 31% RABATT! Die beste Lösung für jeden Newbie oder Expert Trader! Dieser Indikator ist ein einzigartiges, qualitativ hochwertiges und erschwingliches Handelsinstrument, da wir eine Reihe von proprietären Funktionen und eine geheime Formel eingebaut haben. Mit nur EINEM Chart liefert er Alerts für alle 28 Währungspaare. Stellen Sie sich vor, wie sich Ihr Handel verbessern wird, weil Sie in der Lage sind, den genauen Auslösepunkt eines neuen Trends oder einer Scalping-Gelegenheit zu e
Advanced Supply Demand
Bernhard Schweigert
4.9 (271)
Derzeit 33% Rabatt! Die beste Lösung für jeden Anfänger oder erfahrenen Händler! Dieser Indikator ist ein einzigartiges, qualitativ hochwertiges und erschwingliches Trading-Tool, da wir eine Reihe von proprietären Funktionen und eine neue Formel integriert haben. Mit diesem Update werden Sie in der Lage sein, doppelte Zeitrahmenzonen anzuzeigen. Sie können nicht nur einen höheren TF (Zeitrahmen) anzeigen, sondern sowohl den Chart-TF als auch den höheren TF: SHOWING NESTED ZONES. Alle Supply Dema
RelicusRoad Pro
Relicus LLC
4.54 (80)
Jetzt 147 US -Dollar (nach ein paar Aktualisierungen auf 499 US -Dollar) - Unbegrenzte Konten (PCs oder MACs) RelicusRoad Benutzerhandbuch + Schulungsvideos + Zugang zur privaten Discord-Gruppe + VIP-Status EINE NEUE ART, DEN MARKT ZU BETRACHTEN RelicusRoad ist der weltweit leistungsstärkste Handelsindikator für Forex, Futures, Kryptowährungen, Aktien und Indizes und gibt Händlern alle Informationen und Tools, die sie benötigen, um profitabel zu bleiben. Wir bieten technische Analysen un
Scalper Vault
Oleg Rodin
5 (22)
Scalper Vault ist ein professionelles Scalping-System, das Ihnen alles bietet, was Sie für erfolgreiches Scalping benötigen. Dieser Indikator ist ein komplettes Handelssystem, das von Forex- und Binäroptionshändlern verwendet werden kann. Der empfohlene Zeitrahmen ist M5. Das System liefert Ihnen genaue Pfeilsignale in Richtung des Trends. Es liefert Ihnen auch Top- und Bottom-Signale und Gann-Marktniveaus. Die Indikatoren bieten alle Arten von Warnungen, einschließlich PUSH-Benachrichtigungen.
Entdecken Sie das Geheimnis des erfolgreichen Forex -Handels mit unserem benutzerdefinierten MT4 -Indikator! Haben Sie sich jemals gefragt, wie Sie Erfolg auf dem Forex -Markt erzielen können und gleichzeitig Gewinne erzielen und gleichzeitig das Risiko minimieren können? Hier ist die Antwort, nach der Sie gesucht haben! Erlauben Sie uns, unseren proprietären MT4 -Indikator vorzustellen, der Ihren Handelsansatz revolutionieren wird. Einzigartige Vielseitigkeit Unser Indikator ist speziell
Trend Screener
STE S.S.COMPANY
4.79 (81)
Trendindikator, bahnbrechende, einzigartige Lösung für Trendhandel und -filterung mit allen wichtigen Trendfunktionen in einem Tool! Es handelt sich um einen 100 % nicht neu zu malenden Multi-Timeframe- und Multi-Währungs-Indikator, der für alle Symbole/Instrumente verwendet werden kann: Forex, Rohstoffe, Kryptowährungen, Indizes und Aktien. Trend Screener ist ein effizienter Trendfolgeindikator, der Pfeiltrendsignale mit Punkten im Diagramm liefert. Die Funktionen, die im Trendanalysator-Indika
Order Block Hunter
Noha Mohamed Fathy Younes Badr
5 (1)
Order block hunter indicator is the best indicator for  hunt the order blocks that area where there has been a large concentration of limit orders waiting to be executed Order blocks are identified on a chart by observing previous price action and looking for areas where the price experienced significant movement or sudden changes in direction .This indicator does that for you by using very complicated codes and helps you to take the best areas To buy and sell because it make marks at the best a
Best Currency Strength Indicator
Tumelo Patrick Rakotsoane
4.54 (41)
Advanced Currency Strength Indicator The Advanced Divergence Currency Strength Indicator. Not only it breaks down all 28 forex currency pairs and calculates the strength of individual currencies across all timeframes , but, You'll be analyzing the WHOLE forex market in 1 window (In just 1 minute) . This indicator is very powerful because it reveals the true movements of the market.  It is highly recommended to  analyze charts knowing the performance of individual currencies or the countries ec
BITTE LESEN SIE DIE INFORMATIONEN UNTEN, BEVOR SIE DAS PRODUKT KAUFEN! Apollo Pips PLUS SP ist ein einzigartiges Produkt! ES IST FÜR ALLE, DIE MEINEN NEUEN „APOLLO PIPS“-INDIKATOR PLUS „SUPER PACK“-BONUS MIT ZUGRIFF AUF ALLE MEINE HANDELSINDIKATOREN ERHALTEN MÖCHTEN! Mit dem Kauf des Produkts Apollo Pips PLUS SP erwerben Sie tatsächlich eine völlig neue Version meines Apollo Pips-Indikators. Diese Version des Indikators verfügt über einen verbesserten Algorithmus und einen benutzerfreundlichen P
FX Volume
Daniel Stein
4.48 (27)
Erhalten Sie Ihr tägliches Marktupdate mit Details und Screenshots über unser Morning Briefing hier auf mql5 und auf Telegram ! FX Volume ist der ERSTE und EINZIGE Volumenindikator, der einen ECHTEN Einblick in die Marktstimmung aus Sicht eines Brokers bietet. Es bietet fantastische Einblicke in die Positionierung von institutionellen Marktteilnehmern, wie z.B. Brokern, auf dem Forex-Markt, viel schneller als COT-Berichte. Diese Informationen direkt auf Ihrem Chart zu sehen, ist der wahre Game
Currency Strength Exotics
Bernhard Schweigert
4.86 (29)
Stärke von 8 Währungen plus EIN EXOTISCHES Paar oder Rohstoffe oder Indexe! Jedes Produkt kann als 9. Linie hinzugefügt werden. Fügen Sie Rohstoffe, Indexes oder exotische Währungen hinzu (Gold, Silber, Öl, DAX, US30, MXN, TRY, CNH ...). Eine neue noch nie dagewesene TRADING STRATEGIE  !!! Dieser Indikator ist einzigartig, weil wir eine Reihe von proprietäre Funktionen und neue Formeln eingebaut haben. Es funktioniert für alle Zeitrahmen. Basierend auf neuen zugrunde liegenden Algorithmen ist
IX Power MT4
Daniel Stein
5 (5)
IX Power bringt die unschlagbare Präzision von FX Power endlich auch zu Nicht-Forex-Symbolen. Es bestimmt präzise die Intensität von kurz-, mittel- und langfristigen Trends in Ihren Lieblingsindizes, Aktien, Rohstoffen, ETFs und sogar Kryptowährungen. Sie können alles analysieren, was Ihr Terminal zu bieten hat. Probieren Sie es aus und erleben Sie, wie sich Ihr Timing beim Handel deutlich verbessert . IX Power Hauptmerkmale 100% präzise, nicht nachpinselnde Berechnungsergebnisse - für
M1 Arrow
Oleg Rodin
4.67 (12)
Eine Intraday-Strategie, die auf zwei Grundprinzipien des Marktes basiert. Der Algorithmus basiert auf der Analyse von Volumina und Preiswellen mit zusätzlichen Filtern. Der intelligente Algorithmus des Indikators gibt nur dann ein Signal, wenn sich zwei Marktfaktoren zu einem vereinen. Der Indikator berechnet Wellen eines bestimmten Bereichs auf dem M1-Diagramm unter Verwendung der Daten des höheren Zeitrahmens. Und um die Welle zu bestätigen, verwendet der Indikator eine Volumenanalyse. Dieser
`All in One Chart Patterns` Chartmuster sind unter Tradern ein kontroverses Thema; einige glauben, dass sie zuverlässige Signale liefern, während andere dies nicht tun. Unser "Chart Patterns All-in-One"-Indikator zeigt verschiedene Chartmuster an, damit Sie diese Theorien selbst testen können. Die Rentabilität dieser Muster spiegelt nicht die Effektivität des Indikators wider, sondern bewertet vielmehr die Muster selbst. Der "Chart Patterns All-in-One"-Indikator ist ein hervorragendes Werkzeug,
Weitere Produkte dieses Autors
TTF Candles AM
Andriy Matviyevs'kyy
This indicator displays the moment when the TTF oscillator crosses the zero value, and the moment when the TTF oscillator crosses its smoothed value. Crossing the zero value by the TTF oscillator is a buy/sell signal. If the TTF oscillator crosses its smoothed value, it is a signal of a trend change. The signal is given after the end of the formation of the candle. The signal is confirmed when the price crosses the high/low of the bar on which the signal was given. The indicator does not redraw.
TTF Osc AM
Andriy Matviyevs'kyy
This indicator displays the moment when the TTF oscillator crosses the zero value, and the moment when the TTF oscillator crosses its smoothed value. Crossing the zero value by the TTF oscillator is a buy/sell signal. If the TTF oscillator crosses its smoothed value, it is a signal of a trend change. The signal is given after the end of the formation of the candle. The signal is confirmed when the price crosses the high/low of the bar on which the signal was given. The indicator does not redraw.
FATL Momentum AM
Andriy Matviyevs'kyy
This technical indicator is a Momentum indicators built using a fast adaptive digital filter - FATL. In a simplified sense, an adaptive digital filter is a moving average with effective smoothing. Using a digital filter allows you to smooth out sharp fluctuations with minimal signal delay. Using the indicator: It should be taken into account that the values ​​of the indicator on the zero bar (which has not finished forming yet) may change, so decisions should be made after the end of the bar for
Zone Trade AM
Andriy Matviyevs'kyy
The indicator is based on the elements of Bill Williams' trading system. Sell signals are formed when MACD and OsMA values are falling simultaneously (Bill Williams calls these indicators АО and АС in his book), while buy signals appear when both indicators are rising. Thick and thin colored histograms match MACD and OsMA values. If the histogram is greater than 0, the indicator value is rising. Otherwise, it is falling. Positions should be opened when the price exceeds the bar's high or low, at
ADX Trigger AM
Andriy Matviyevs'kyy
The indicator is an interpretation of the Average Directional Movement Index (ADX) allowing you to determine if there is a price trend. It was developed by Welles Wilder and described in his book "New concepts in technical trading systems". The indicator determines entry points and uses crossing of ADX +/- lines and growth or fall of the main ADX line. When the indicator crosses the zero line, the trend is changed. If the oscillator's value is 1 - the price grows, the trend remains; If the oscil
BarLineBreak AM
Andriy Matviyevs'kyy
The indicator detects the current trend using the following definition: A trend is a market situation when each subsequent peak is higher/lower than the previous one, as well as each subsequent bottom is higher/lower than the previous one. Exceeding all previous peaks/bottoms on the specified amount of bars by the current peak/bottom is considered to be a beginning of a new trend. The indicator paints bars according to an identified trend. The indicator does not repaint. Settings: Lines_Bre
RSI Signal AM
Andriy Matviyevs'kyy
This indicator displays the signals based on the values of the classic RSI indicator on the price chart. The RSI can be used for determining the overbought or oversold areas on the chart. Reaching these levels means that the market can soon turn around, but it does not give signal, as in a strong trend the market can stay in the overbought or oversold state for quite a long time. As with most oscillators, the signals are generated when leaving these areas. This indicator allows to display three
WPR Signal AM
Andriy Matviyevs'kyy
This indicator displays the signals based on the values of the classic WPR indicator. The WPR indicator can be used for determining the overbought or oversold areas on the chart. Reaching these levels means that the market can soon turn around, but it does not give signal, as in a strong trend the market can stay in the overbought or oversold state for quite a long time. As with most oscillators, the signals are generated when leaving these areas. This indicator allows to display three types of
CCI Signal AM
Andriy Matviyevs'kyy
This indicator displays the signals based on the values of the classic CCI indicator on the price chart. The CCI can be used for determining the overbought or oversold areas on the chart. Reaching these levels means that the market can soon turn around, but it does not give signal, as in a strong trend the market can stay in the overbought or oversold state for quite a long time. As with most oscillators, the signals are generated when leaving these areas. This indicator allows to display three
DeM Signal AM
Andriy Matviyevs'kyy
This indicator displays the moment when the DeMarker oscillator crosses its smoothed value. If the DeMarker oscillator crosses its smoothed value, it is a signal of a trend change. The signal is given after the end of the formation of the candle. The signal is confirmed when the price crosses the high/low of the bar on which the signal was given. The indicator does not redraw. Custom Parameters: DeM_Period (>1) - DeMarker indicator period; MA_Period - period for smoothing DeMarker indicator va
ADX Signal AM
Andriy Matviyevs'kyy
The indicator is an interpretation of the Average Directional Movement Index (ADX) allowing you to determine if there is a price trend. It was developed by Welles Wilder and described in his book "New concepts in technical trading systems". The indicator shows signals on the price chart when +DI и -DI intersect and when an ADX value rises or falls relative to the +DI и -DI positional relationship. The indicator's buy signals work just like a support level, while the sell signals work like a resi
Impulsive Trade AM
Andriy Matviyevs'kyy
This indicator displays elements of the trading system described by Alexander Elder. This indicator uses the idea of opening sell deals in the period of MACD (or OsMA) falling below zero and opening buy deals when the indicator values rise above zero, in case this fall or rise coincide with the Moving Average direction. The thick and thin histograms correspond to the values of MACD and OsMA. If a histogram is above 0, the indicator value is greater than 0. If it is below, the indicator value is
FATL Arrows AM
Andriy Matviyevs'kyy
This indicator generates signals when the close price values ​​go beyond the channel built using the FATL fast digital filter. Application is extremely simple: The up arrow is a buy signal. Down arrow - sell signal. The signal must be confirmed by the price breaking the high/low of the bar on which the signal was given. The indicator is effective for trend trading. Thus, to open a position, it is necessary to take into account the trend of a higher period. Signals against the trend of a higher p
RSX Signal AM
Andriy Matviyevs'kyy
The indicator displays the signals of the RSX oscillator. The main type of signal is given when the oscillator exceeds the 0 value. If the "Sensitivity" parameter increases above zero, the main signal will also be given when overbought/oversold levels are overcome, defined as zero plus sensitivity and zero minus sensitivity. An additional signal is given when the direction of the oscillator line changes. It is optimal to use the indicator signals as signals to open a trade when the price overcom
Stop Bar AM
Andriy Matviyevs'kyy
The indicator accurately identifies a short-term trend both on trend and flat markets. The confirmation of the signal is the overcoming by the price of the high/low of the bar on which the signal was given. Signals are given on fully formed bars and are not redrawn. Calculations are based on the system of Moving Averages. The indicator is highly sensitive. Use it together with other technical analysis indicators. Settings: Sensitivity - amount of bars for the indicator calculation (1 or higher
MFI Signal AM
Andriy Matviyevs'kyy
5 (1)
This indicator displays the signals based on the values of the classic Money Flow Index (MFI) indicator on the price chart. The volume is considered during the calculation of the MFI values. The MFI can be used for determining the overbought or oversold areas on the chart. Reaching these levels means that the market can soon turn around, but it does not give signal, as in a strong trend the market can stay in the overbought or oversold state for quite a long time. As with most oscillators, the s
ADX Candles AM
Andriy Matviyevs'kyy
This indicator colors candles in accordance with the projected price movement. The analysis is based on the values of the classic ADX. If the DMI+ line is above the DMI- line - the candlestick is painted in color that signals a price growth; If the DMI+ line is below the DMI- line - the candlestick is painted in color that signals a price fall. The indicator does not redraw on completed candlesticks. The forming candlestick can change its color depending on the current data. Thus, it is recommen
SuperTrend AM
Andriy Matviyevs'kyy
SuperTrend AM is an indicator that allows you to open a position at the very beginning of a significant price movement. The second most important quality of the indicator is the ability to follow the trend as long as possible in order to obtain all potential profits while minimizing potential losses. This indicator does not repaint or not recalculate. A version of this indicator with advanced settings and signal notifications is  SuperTrend 3 AM . Signal of the indicator: red arrow appearing a
HyperSignal AM
Andriy Matviyevs'kyy
The  indicator generates signals for opening positions. The principle of operation is to compare the current average price with a range of average prices over a longer period. The signals are confirmed when the price exceeds the High/Low of the bar where the indicator generated the signal.  Maintenance of an open position is carried out on a smaller TF. Indicator signals to open an opposite position on a smaller TF are a signal to close the deal. This indicator does not repaint or not recalculat
EasyTrend AM
Andriy Matviyevs'kyy
EasyTrend AM is an indicator that allows you to open a position at the very beginning of a significant price movement. The second most important quality of the indicator is the ability to follow the trend as long as possible in order to obtain all potential profits while minimizing potential losses. This indicator does not repaint or not recalculate. A version of this indicator with advanced settings and signal notifications is EasyTrend 3 AM . Signal of the indicator: red arrow appearing abov
FATL Line AM
Andriy Matviyevs'kyy
The presented indicator is a moving average based on the fast digital filter (FATL) data. Using the indicator is similar to using a standard moving average: For small values ​​of the period of the moving average (1-10): Buying/selling is carried out at the moment of changing the direction of the moving average (after the price has overcome the high/low of the bar on which the change of direction occurred). For large values ​​of the period of the moving average: Buying / selling is carried out de
ZT Signal AM
Andriy Matviyevs'kyy
The indicator displays elements of the trading system, name trading in the zone, described by Bill Williams. Sell signals are formed when MACD and OsMA values are falling simultaneously (Bill Williams calls these indicators АО and АС in his book), while buy signals appear when both indicators are rising. The indicator has no configurable parameters. (Indicator variant in which MACD and OsMA parameters can be changed - ZT Signal 2 AM ). The indicator signals are confirmed when the price exceeds t
Fine Trade AM
Andriy Matviyevs'kyy
Not all price changes can be used for trading, as small price fluctuations do not allow you to make a profit. The presented indicator with high efficiency gives signals about the moments of a significant change in the direction of price movement. The indicator is intuitive and easy to use. The indicator signal is generated after the completion of the bar, where the indicator changes its position relative to zero. Never repaints signal. The indicator signals must be confirmed by the price exceedi
TTF Line AM
Andriy Matviyevs'kyy
The indicator analyzes TTF and ATR data to define the current trend and allow traders to gain maximum profit from strong price movements. The indicator is intuitively clear: line direction change - trend direction change. Change of the line color warns of a coming direction change. Customized parameters: Ind_Period (>1) - TTF calculation period; Sensitivity (>1) - ATR sensitivity. Alerts - show a dialog box containing user data; Send_Mail - sends an email using an address specified on the Em
Step RSI AM
Andriy Matviyevs'kyy
This indicator is an interpretation of the values of the classic indicator - RSI. A filter is used to smooth the sharp fluctuations of the indicator values, eliminating the weak changes and focusing the trader's attention on strong fluctuations of values. The indicator is not redrawn on completed bars. For greater efficiency of this indicator, it should be used in conjunction with the indicators that identify the trend direction, as well as support/resistance levels. Signals: Histogram crossing
ADX Line AM
Andriy Matviyevs'kyy
The indicator analyzes ADX and ATR data to define the current trend and allow traders to gain maximum profit from strong price movements. The indicator is intuitively clear: line direction change - trend direction change. Change of the line color warns of a coming direction change. Extended version of this indicator - Line on Osc . Customized parameters: Ind_Period (>1) - ADX calculation period; Sensitivity (>1) - ATR sensitivity. Alerts - show a dialog box containing user data; Send_Mail - send
FATL cci AM
Andriy Matviyevs'kyy
The product combines the best features of the standard CCI oscillator with the adaptive digital filter. The indicator allows entering and exiting the market at the very beginning and end of a trend. The indicator generates high-probability signals while retaining high sensitivity. The indicator does not repaint on fully formed bars. Options: Ind_Price - price used for the indicator calculation; Ind_Period - indicator period. Application rules: A big red dot - a strong bearish trend, if the price
FATL Alligator AM
Andriy Matviyevs'kyy
This indicator is a combination of classic trend indicator and signals of the fast digital filter. The indicator has no configurable parameters. The signals are displayed on completed bars and are not redrawn. It shows high efficiency on periods greater than 1 hour. The usage principle is intuitive - trade in the direction shown by the fan of moving averages. Enter once the price exceeds the High/Low of the bar where the signal was formed. Exit on the opposite conditions.
SATL Alligator AM
Andriy Matviyevs'kyy
This indicator is a combination of classic trend indicator and signals of the slow digital filter. The indicator has no configurable parameters. The signals are displayed on completed bars and are not redrawn. It shows high efficiency on periods less than 1 hour. The usage principle is intuitive - trade in the direction shown by the fan of moving averages. Enter once the price exceeds the High/Low of the bar where the signal was formed. Exit on the opposite conditions.
Laguerre Osc 2 AM
Andriy Matviyevs'kyy
The presented indicator uses the Laguerre filter to build an oscillator. The indicator has the possibility of double additional smoothing, which can be useful for small values ​​of the Gamma parameter. The indicator gives three types of signals: Exit of the oscillator from the overbought / oversold zone; The oscillator crossing the middle of the value between the overbought/oversold zones; The oscillator enters the overbought/oversold zone. On fully formed candles, the indicator does not redraw.
Auswahl:
Keine Bewertungen
Antwort auf eine Rezension
Version 26.0 2023.09.20
Updated to version 26+.
Version 25.1 2023.08.27
Updated.
Version 25.0 2023.08.08
Updated to version 25+.
Version 20.0 2023.07.21
Updated.
Version 3.50 2023.06.03
New version.
Version 3.0 2023.05.07
Косметические исправления.
Version 2.0 2023.05.01
Устранена ошибка отображения.