• Übersicht
  • Bewertungen (3)
  • Diskussion
  • Neue Funktionen

Fixed Range Volume Profile MT5

2
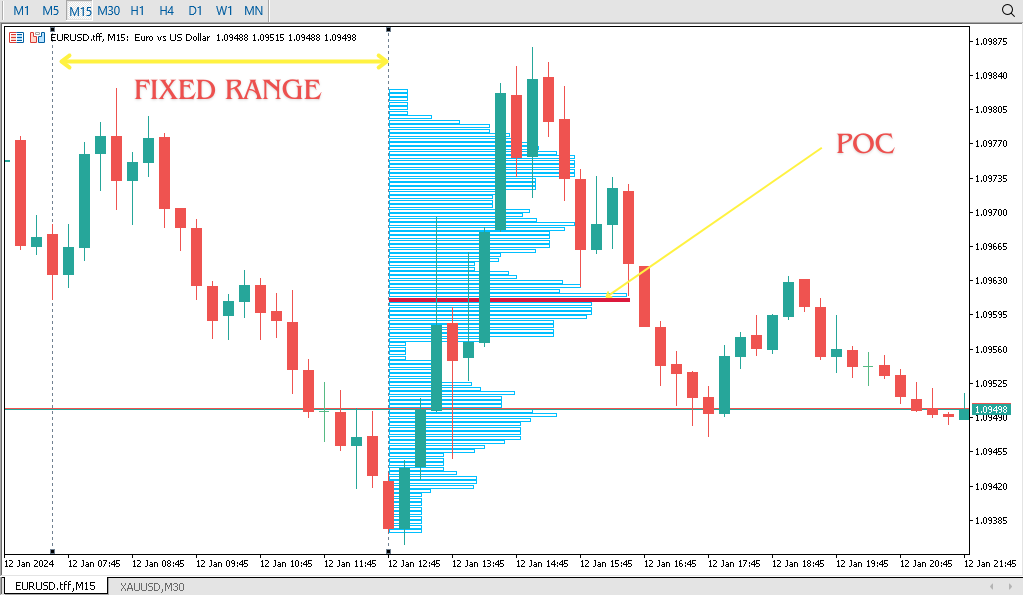
Auto Fixed Range Volume Profile mit Warnungen für MT5

Dieser Indikator zeigt, wo der Preis mehr Zeit verbracht hat, und hebt wichtige Niveaus hervor, die beim Handel verwendet werden können.

und kann die Preisdichte im Laufe der Zeit anzeigen und die wichtigsten Preisniveaus, den Wertbereich und den Kontrollwert einer bestimmten Handelssitzung umreißen. Dieser Indikator kann an Zeitrahmen zwischen M1 und D1 angehängt werden und zeigt das Marktprofil für tägliche, wöchentliche, monatliche oder sogar Intraday-Sitzungen an. Niedrigere Zeitrahmen bieten eine höhere Präzision. Höhere Zeitrahmen werden für eine bessere Sichtbarkeit empfohlen. Es ist auch möglich, eine Sitzung zum kostenlosen Zeichnen von Rechtecken zu verwenden, um ein benutzerdefiniertes Marktprofil für einen beliebigen Zeitrahmen zu erstellen. Sechs verschiedene Farbschemata stehen zur Verfügung, um die Blöcke des Profils zu zeichnen. Das Zeichnen von Profilen als einfarbiges Histogramm ist ebenfalls möglich. Alternativ können Sie das Profil basierend auf bullischen/bärischen Balken einfärben. Dieser Indikator basiert auf der bloßen Preisbewegung und verwendet keine Standardindikatoren.

Ein Alarmsystem ist verfügbar, wenn der Preis die Wertebereiche High und Low, Median und Single Print überschreitet.

Eingabeeinstellungen :

StartFromDate (Standard = __DATE__) — wenn StartFromCurrentSession falsch ist, beginnt der Indikator ab diesem Datum mit dem Zeichnen von Profilen. Es zieht in die Vergangenheit. Wenn Sie beispielsweise 2018-01-20 festlegen und SessionsToCount 2 ist, werden die Profile für 2018-01-20 und 2018-01-19 gezeichnet.


Sitzung (Standard = Täglich) – Handelssitzung für das Marktprofil: Täglich, Wöchentlich, Monatlich, Intraday und Rechteck. Damit eine rechteckige Sitzung berechnet wird, muss dem Diagramm ein rechteckiges Diagrammobjekt hinzugefügt werden, dessen Name mit MPR beginnt. Durch Drücken von 'r' auf der Tastatur wird automatisch ein richtig benanntes rechteckiges Objekt hinzugefügt.


StartFromCurrentSession (default = true) – wenn true, beginnt der Indikator ab heute zu zeichnen, andernfalls – ab dem in StartFromDate angegebenen Datum.


SeamlessScrollingMode (Standard = false) – Bei true werden die Parameter StartFromDate und StartFromCurrentSession ignoriert; Die Sitzungen werden berechnet und angezeigt, beginnend mit dem Balken ganz rechts an der aktuellen Diagrammposition. Auf diese Weise können Sie unbegrenzt in der Zeit zurückscrollen, um vergangene Sitzungen anzuzeigen.


ValueAreaPercentage (Standard = 70) – ein prozentualer Anteil der TPOs der Sitzung, die in den Wertebereich aufgenommen werden sollen.


SessionsToCount (Standard = 2) — für wie viele Handelssitzungen die Marktprofile gezeichnet werden sollen.
EnableDevelopingPOC (Standard = false) – Wenn „true“, werden mehrere horizontale Linien gezeichnet, um darzustellen, wie sich der Point of Control während der Sitzung entwickelt hat.
Empfohlene Produkte
Market Profile Heat indicator  — is a classic Market Profile implementation that can show the price density over time, outlining the most important price levels, value area, and control value of a given trading session. This indicator can be attached to timeframes between M1 and D1 and will show the Market Profile for daily, weekly, monthly, or even intraday sessions. Lower timeframes offer higher precision. Higher timeframes are recommended for better visibility. It is also possible to use a f
BoxChart MT5
Evgeny Shevtsov
5 (7)
The market is unfair if only because 10% of participants manage 90% of funds. An ordinary trader has slim changes to stand against these "vultures". This problem can be solved. You just need to be among these 10%, learn to predict their intentions and move with them. Volume is the only preemptive factor that faultlessly works on any timeframe and symbol. First, the volume appears and is accumulated, and only then the price moves. The price moves from one volume to another. Areas of volume accumu
Live-Übertragung des Indikators auf YouTube. Bitte klicken Sie auf den Link unten, um mehr Glaubwürdigkeit zu erhalten. Es gibt auch Videos des Indikators, die Sie sich ansehen können. Beachten Sie, dass die Übertragung spät ist, verlassen Sie sich nicht darauf. Nur eine Überprüfung des Indikators ist nur eine Überprüfung der Genauigkeit des Indikators, der fast nicht verliert und die Gewinnrate 95% erreicht Ich werde mit großer Genauigkeit an der CRASH-Münze 1000 INDICES arbeiten
VP hidden
Emr Aljnaby
4.43 (7)
The indicator works to convert normal volume into levels and determine financial liquidity control points. It is very similar in function to Fixed Volume Profile. But it is considered more accurate and easier to use than the one found on Trading View because it calculates the full trading volumes in each candle and in all the brokers present in MetaTrade, unlike what is found in Trading View, as it only measures the broker’s displayed prices. To follow us on social media platforms: tel
FREE
Session CVD
Riccardo Moreo
This is the Cumulative Volume Delta (CVD) , it's an indicator that calculates the long and short volumes plotting it then as a line on the chart, the most efficient way to use this indicator is by comparing the CVD line to the current chart and looking at the Divergence beetween the two of them, so that you can identify fake-outs and liquidty sweeps. for example in the picture that i put below you can see that the price has made a lower low but the CVD didn't, that means the volumes didn't suppo
FREE
This indicator will show a vertical representation of the volume distribution within a selected user range. This is a free version of the full product. It is limited to use on a week old data or older. Find the full product at  https://www.mql5.com/en/market/product/42234 . Main features: This Indicator will create an image that will allow viewing the tick volume per price level in a graphical form. The indicator will work on any range size in any time-frame, limited only by your computer m
FREE
Was: $249  Now: $99   Market Profile defines a number of day types that can help the trader to determine market behaviour. A key feature is the Value Area, representing the range of price action where 70% of trading took place. Understanding the Value Area can give traders valuable insight into market direction and establish the higher odds trade. It is an excellent addition to any system you may be using. Inspired by Jim Dalton’s book “Mind Over Markets”, this indicator is designed to suit the
Z Score Plus MT5
Eduardo Da Costa Custodio Santos
Im Finanzwesen sind Z-Scores ein Maß für die Variabilität einer Beobachtung und können von Händlern verwendet werden, um die Marktvolatilität zu bestimmen. Z-Scores sagen Händlern, ob ein Score für einen bestimmten Datensatz typisch oder atypisch ist. Z-Scores ermöglichen es Analysten auch, Scores aus mehreren Datensätzen anzupassen, um Scores zu erstellen, die genauer miteinander verglichen werden können. # In der Praxis haben wir den ZScore mit Nullpunkt und Oszillationen zwischen 2 und 3 für
The utility displays the order book, as well as increases its depth, remembering the location of applications that have gone beyond the current "window" view. With the utility user can perform quick trading actions in one click - placing/cancelling/editing of explicit and hidden orders, and also opening/editing positions. Utility features The orders book display works only on those trading symbols for which it is broadcast by the broker. To reset the information about the rows that were record
Forex Volume MT5
KEENBASE SOFTWARE SOLUTIONS
KT Forex Volume shows the buying and selling volume of a currency pair in the form of a colored histogram. The volume is made of buying and selling transactions in an asset. In FX market: If the buying volume gets bigger than the selling volume, the price of a currency pair would go up. If the selling volume gets bigger than the buying volume, the price of a currency pair would go down. Features Avoid the bad trades by confirming them using the tick volume data. It helps you to stay on the si
VolumeProfile MT5
Robert Hess
3.75 (8)
Beschreibung: Das Volumen Profil zeigt detailierte Informationen von historischen trading Aktivitäten in bestimmten Preisbereichen (Markt Profil/Preis Profil).  Damit finden Sie die Zonen mit den besten Preisen im Markt und erlangen so einen entscheidenen Vorteil gegenüber anderen Marktteilnehmern. Features: Anpassbares Volume Profil / Markt Profil Zeigt den "fairen" Preisbereich in dem 70% des gesamten Volumens umgesetzt werden Zeigt kritische Zonen mit niedrigem Volumen Zeigt Volume Point
Heatmap Volume Profile
Olexandr Savchuk
4.25 (4)
A Heatmap with a Volume Profile is like a thermal imager or x-ray machine. It will help you to estimate the relative distribution of volume during the price movement and to understand  the relationship between volume and price. Indicator Volume Profile "Volumos Maxima" is a powerful tool for analyzing this relationship. After simple experimentation with heatmap, you can find that each trading instrument has its own “ characteristic ” way of distributing volume. And this will help you to make a b
This indicator allows you to enjoy the two most popular products for analyzing request volumes and market deals at a favorable price: Actual Depth of Market Chart Actual Tick Footprint Volume Chart This product combines the power of both indicators and is provided as a single file. The functionality of Actual COMBO Depth of Market AND Tick Volume Chart is fully identical to the original indicators. You will enjoy the power of these two products combined into the single super-indicator! Below is
To get access to MT4 version please click here . This is the exact conversion from TradingView: " WaveTrend" by LazyBear. This is a light-load processing and non-repaint indicator. All input options are available. Buffers are available for processing in EAs. You can message in private chat for further changes you need. The filling area option is omitted to fit into MT5 graphics.
Der Indikator erstellt aktuelle Notierungen, die mit historischen verglichen werden können, und auf dieser Grundlage eine Preisbewegungsprognose erstellen. Der Indikator verfügt über ein Textfeld zur schnellen Navigation zum gewünschten Datum. Optionen: Symbol - Auswahl des Symbols, das der Indikator anzeigen soll; SymbolPeriod - Auswahl des Zeitraums, aus dem der Indikator Daten aufnimmt; IndicatorColor - Indikatorfarbe; HorisontalShift - Verschiebung der vom Indikator gezeichnet
Blahtech Supply Demand MT5
Blahtech Limited
4.54 (13)
Was: $299  Now: $99   Supply Demand uses previous price action to identify potential imbalances between buyers and sellers. The key is to identify the better odds zones, not just the untouched ones. Blahtech Supply Demand indicator delivers functionality previously unavailable on any trading platform. This 4-in-1 indicator not only highlights the higher probability zones using a multi-criteria strength engine, but also combines it with multi-timeframe trend analysis, previously confirmed swings
BoxProfile MT5
Evgeny Shevtsov
4.56 (9)
The indicator displays volume profiles based on the nesting principle. Profiles periods are pre-set so that each subsequent profile has a length twice as long as the length of the previous profile. In addition to profiles, the indicator displays volume clusters sorted by color, depending on the volume they contain. Indicator operation features The indicator works on typical timeframes from M5 to MN, but for calculations uses historical data from smaller timeframes: M1 - for timeframes from M5
FREE
AW Candle Patterns
AW Trading Software Limited
Der AW-Kerzenmuster-Indikator ist eine Kombination aus einem fortschrittlichen Trendindikator und einem leistungsstarken Kerzenmuster-Scanner. Es ist ein nützliches Werkzeug, um die dreißig zuverlässigsten Candlestick-Muster zu erkennen und hervorzuheben. Darüber hinaus ist es ein aktueller Trendanalysator, der auf farbigen Balken mit einem basiert       Plug-in-Multi-Timeframe-Trendpanel, das in der Größe verändert und positioniert werden kann. Eine einzigartige Fähigkeit, die Anzeige von Muste
Call/Put Ratio is one of the most well-known indicators of the market sentiment. The indicator has been developed by Martin Zweig. It is based on real volumes of the CBOE option market. As we know, a Call option gives its owner the right to buy the underlying asset at a predetermined price. A Put option gives the right to sell it. Thus, increasing volumes for Call options indicate the increasing demand. The growth of Put option volumes shows that supply starts exceeding demand. If we divide the
Volume Profile เป็นเครื่องมือที่ใช้สำหรับการวิเคราะห์ระดับการซื้อขายของตลาดในแต่ละระยะเวลาโดยใช้ปริมาณการซื้อขาย (volume) ซึ่งช่วยให้เราเข้าใจว่ามีการซื้อขายเกิดขึ้นมากที่สุดที่ราคาใด รวมทั้งช่วยในการหาจุดที่มีความนิยมในการซื้อขาย (Point of Control: POC) และระดับการซื้อขายอื่น ๆ ที่สำคัญ เรียกว่า Value Area. การใช้งาน Volume Profile ในการวิเคราะห์ตลาดมักจะมีขั้นตอนดังนี้: กำหนดระยะเวลาที่ต้องการวิเคราะห์ : เราต้องกำหนดระยะเวลาที่เราสนใจในการวิเคราะห์ Volume Profile เช่น ชั่วโมง, วัน, หรือสัปดาห์
Delta Single Volume is a very powerful indicator that reads the supply on the Market. It calculates the Delta from movement of the price and the difference of BUY and SELL volumes. Its special structure allows you to get all timeframe values available on the MT5 platform. It works on Tick Volumes and Real Volumes (if avalaibles on your Broker). A good observation of this instrument can suggest great entry points and possible reversal. We are confident that this tool will help you to improve yo
Description: The indicator of tick volumes Better Volume MT5 allows you to assess the general mood of the market and quite accurately catch the moments of the formation of large movements. The indicator is a color histogram in an additional window. In the calculation of Better Volume MT5 the Price Action combinations are taken into account, the values of the volumes with the height of columns and color marking are displayed. Input parameters: MAPeriod - period for calculating the moving average
Market book
Aliaksandr Hryshyn
Tiefe der Marktanzeige. Es können bis zu 16 Instrumente angezeigt werden. Es gibt ein automatisches Scrollen der Preise, das durch Klicken auf "A" oben im Fenster deaktiviert werden kann. Es ist ein ziemlich schöner Indikator, es kann als Begrüßungsbildschirm fungieren, es wird nicht so langweilig sein, wie ein normales Diagramm auszusehen, genau richtig für die Meditation, besonders nach großen Marktverlusten. Der Indikator ist nicht für den Handel bestimmt, daher ist Ihre Einzahlung vollständi
Entdecken Sie die Macht der Volumenanalyse mit unserem Volumenprofil-Indikator für Metatrader!   /   MT4-Version Basic Volume Profile ist ein Indikator, der speziell für manuelle Trader entwickelt wurde, die ihren Handel optimieren wollen. Der Volumenprofil-Indikator ist ein unverzichtbares Werkzeug für jeden ernsthaften Trader, der das Marktverhalten besser verstehen möchte. Mit unserer innovativen Lösung können Sie klar und übersichtlich darstellen, wie sich das Handelsvolumen auf die Preis
This new unique indicator Actual tick footprint (volume chart) is developed for using on Futures markets, and it allows seeing the volume of real deals right when they are performed. The indicator Actual tick footprint (volume chart) represents a greatly enhanced tick chart that includes additional information about the volume of deal performed at a specific price. In addition, this unique indicator for MetaTrader 5 allows to clearly detecting a deal type – buy or sell. Alike the standard tick c
Die Einzigartigkeit dieses Indikators liegt im Volumenabrechnungsalgorithmus: Die Akkumulation erfolgt direkt für den ausgewählten Zeitraum ohne Bezug auf den Tagesbeginn. Die letzten Balken können aus der Berechnung ausgeschlossen werden, dann haben die aktuellen Daten weniger Einfluss auf die vorher gebildeten signifikanten Niveaus (Volumina). Für eine genauere Berechnung werden standardmäßig Daten aus dem M1-Diagramm verwendet. Der Verteilungsschritt der Preismengen ist geregelt. Standardmäßi
VR Grid Mt5
Vladimir Pastushak
3.6 (10)
Der VR-Raster-Indikator ist entwickelt , um ein grafisches Raster mit benutzerdefinierten Einstellungen zu erstellen. Im Gegensatz zum Standardgitter wird VR Grid zum Erstellen von kreisförmigen Ebenen verwendet. Je nach Wahl des Benutzers kann der Schritt zwischen den Rundenstufen beliebig sein. Darüber hinaus behält VR Grid im Gegensatz zu anderen Indikatoren und Dienstprogrammen die Position des Rasters bei, selbst wenn sich der Zeitraum ändert oder das Terminal neu gestartet wird. Einstellun
FREE
Seconds Charts Demo
Aleksandr Goryachev
5 (1)
Micro  Demo  ******************* Секундные графики в Meta Trader 5 ********************** Более точного инструмента для входа в сделку вы не найдёте. Платная полная версия:  Micro "Second charts" В демоверсии секундные периоды сменяются случайным образом через случайные интервалы времени. Отсутствует автоматическая настройка периодов бесплатных индикаторов.   Входные параметры: Displayed bars - отображаемые бары Step of price levels, pp, 0-off - шаг отрисовки ценовых уровней, пункты Scale
FREE
Volume Profile For MT5
Abdelkhabir Yassine Alaoui
Volume Profile is a very useful indicator . it allows you to spot the price levels where important price action took place. It is similar to support and resistance levels but with a different logic. ( Check Out  Fixed Range Volume Profile MT5  ) One of the first thing that traders mark up when analyzing a chart is support and resistance. Volume Profile can be used for doing that too. The indicator scans the defined number of previous bars and calculates the volume of activity at each price
Tick Chart — full-featured chart for MetaTrader 5. A utility for creating and working with a tick chart in the MetaTrader 5 terminal. You can create a tick chart that works exactly the same as a regular chart. You can apply indicators, Expert Advisors and scripts to the tick chart. You get a fully functional tick chart on which you can work just as well as on a regular chart. You can enable the output of the Ask price data. The data are generated in the form of the upper shadow of a tick bar. Fr
Käufer dieses Produkts erwarben auch
Atomic Analyst MT5
Issam Kassas
5 (15)
Zunächst einmal ist es erwähnenswert, dass dieser Handelsindikator nicht neu malt, nicht neu zeichnet und keine Verzögerung aufweist, was ihn sowohl für manuellen als auch für Roboterhandel ideal macht. Benutzerhandbuch: Einstellungen, Eingaben und Strategie. Der Atom-Analyst ist ein PA-Preisaktionsindikator, der die Stärke und das Momentum des Preises nutzt, um einen besseren Vorteil auf dem Markt zu finden. Ausgestattet mit fortschrittlichen Filtern, die helfen, Rauschen und falsche Signale z
Quantum Trend Sniper
Bogdan Ion Puscasu
5 (46)
Wir stellen vor       Quantum Trend Sniper Indicator   , der bahnbrechende MQL5-Indikator, der die Art und Weise, wie Sie Trendumkehrungen erkennen und handeln, verändert! Entwickelt von einem Team erfahrener Händler mit über 13 Jahren Handelserfahrung,       Quantum Trend Sniper-Indikator       wurde entwickelt, um Ihre Trading-Reise mit seiner innovativen Methode zur Identifizierung von Trendumkehrungen mit extrem hoher Genauigkeit auf ein neues Niveau zu heben. ***Kaufe Quantum Trend Snipe
Zunächst einmal ist es wichtig zu betonen, dass dieses Handelssystem ein Nicht-Repainting-, Nicht-Redrawing- und Nicht-Verzögerungsindikator ist, was es sowohl für manuelles als auch für automatisches Trading ideal macht. Online-Kurs, Handbuch und Vorlagen herunterladen. Das "Smart Trend Trading System MT5" ist eine umfassende Handelslösung, die für neue und erfahrene Trader maßgeschneidert ist. Es kombiniert über 10 Premium-Indikatoren und bietet mehr als 7 robuste Handelsstrategien, was es zu
Dies ist ein Indikator für MT5, der genaue Signale für den Einstieg in einen Handel ohne Repainting (Neuzeichnen) liefert. Er kann auf alle Finanzwerte angewendet werden: Forex, Kryptowährungen, Metalle, Aktien, Indizes. Er liefert ziemlich genaue Schätzungen und sagt Ihnen, wann es am besten ist, eine Position zu eröffnen und zu schließen. Sehen Sie sich das Video (6:22) mit einem Beispiel für die Verarbeitung nur eines Signals an, das sich für den Indikator gelohnt hat! Die meisten Händler ver
Gold Stuff mt5
Vasiliy Strukov
4.9 (181)
Gold Stuff mt5-Ein Trendindikator, der speziell für Gold entwickelt wurde, kann auch auf allen Finanzinstrumenten verwendet werden. Der Indikator wird nicht neu gezeichnet und verzögert sich nicht. Empfohlener Zeitrahmen H1. WICHTIG! Kontaktieren Sie mich sofort nach dem Kauf, um Anweisungen und Bonus zu erhalten!     Sie können eine kostenlose Kopie unseres Strong Support- und Trendscanner-Indikators erhalten, bitte senden Sie uns eine persönliche Nachricht. Mich! DATEN Draw Arrow - in
AT Forex Indicator MT5
Marzena Maria Szmit
5 (4)
The AT Forex Indicator MT5 is a sophisticated trading tool designed to provide traders with a comprehensive analysis of multiple currency pairs. This powerful indicator simplifies the complex nature of the forex market, making it accessible for both novice and experienced traders. AT Forex Indicator uses advanced algorithms to detect trends, patterns and is an essential tool for traders aiming to enhance their forex trading performance. With its robust features, ease of use, and reliable signal
FX Power MT5 NG
Daniel Stein
5 (5)
Erhalten Sie Ihr tägliches Marktupdate mit Details und Screenshots über unser Morning Briefing hier auf mql5 und auf Telegram ! FX Power MT5 NG ist die nächste Generation unseres langjährig sehr beliebten Währungsstärkemessers FX Power. Und was bietet dieser Stärkezähler der nächsten Generation? Alles, was Sie am ursprünglichen FX Power geliebt haben PLUS GOLD/XAU-Stärkeanalyse Noch präzisere Berechnungsergebnisse Individuell konfigurierbare Analysezeiträume Anpassbares Berechnungslimit für noc
Trend Screener Pro MT5
STE S.S.COMPANY
4.88 (66)
Nutzen Sie die Macht des Trendhandels mit Trend Screener Indicator: Ihrer ultimativen Trendhandelslösung, die auf Fuzzy-Logik und einem System mit mehreren Währungen basiert! Steigern Sie Ihren Trendhandel mit Trend Screener, dem revolutionären Trendindikator mit Fuzzy-Logik. Es handelt sich um einen leistungsstarken Trendfolgeindikator, der über 13 Premium-Tools und -Funktionen sowie 3 Handelsstrategien kombiniert und ihn zu einer vielseitigen Wahl macht, um Ihren Metatrader in einen Trendanaly
Zunächst einmal ist es wichtig zu betonen, dass dieses Handelstool ein Nicht-Repaint-, Nicht-Redraw- und Nicht-Verzögerungsindikator ist, was es ideal für professionelles Trading macht. Online-Kurs, Benutzerhandbuch und Demo. Der Smart Price Action Concepts Indikator ist ein sehr leistungsstarkes Werkzeug sowohl für neue als auch erfahrene Händler. Er vereint mehr als 20 nützliche Indikatoren in einem und kombiniert fortgeschrittene Handelsideen wie die Analyse des Inner Circle Traders und S
FX Volume MT5
Daniel Stein
4.94 (17)
Erhalten Sie Ihr tägliches Marktupdate mit Details und Screenshots über unser Morning Briefing hier auf mql5 und auf Telegram ! FX Volume ist der ERSTE und EINZIGE Volumenindikator, der einen ECHTEN Einblick in die Marktstimmung aus Sicht eines Brokers bietet. Es bietet fantastische Einblicke in die Positionierung von institutionellen Marktteilnehmern, wie z.B. Brokern, auf dem Forex-Markt, viel schneller als COT-Berichte. Diese Informationen direkt auf Ihrem Chart zu sehen, ist der wahre Game
Reversal First Impulse levels (RFI)      INSTRUCTIONS        RUS       -       ENG              R ecommended to use with an indicator   -   TPSpro  TREND PRO -  Version MT4                 A key element in trading is zones or levels from which decisions to buy or sell a trading instrument are made. Despite attempts by major players to conceal their presence in the market, they inevitably leave traces. Our task was to learn how to identify these traces and interpret them correctly. Main functi
XQ Indicator MetaTrader 5
Marzena Maria Szmit
5 (1)
Step into the realm of Forex trading with confidence and precision using XQ, a cutting-edge Forex indicator designed to elevate your trading game to unprecedented heights. Whether you're a seasoned trader or just stepping into the world of currency exchange, XQ Forex Indicator empowers you with the insights and signals needed to make informed trading decisions. The signal conditions are a combination of three indicators, and XQ Forex Indicator only display  medium and long-term trends . The ind
TPSproTREND PrO MT5
Roman Podpora
4.88 (8)
TPSpro TRENDPRO  - is a trend indicator that automatically analyzes the market and provides information about the trend and each of its changes, as well as giving signals for entering trades without redrawing! The indicator uses each candle, analyzing them separately. referring to different impulses - up or down impulse. Exact entry points into transactions for currencies, crypto, metals, stocks, indices!  -  Version MT4               DETAILED DESCRIPTION               R ecommended to use with
Der Forex TPA Indikator deckt die wahren Aktionen der Marktmacher auf, immer dann wenn sie passieren. "Kämpfe nicht gegen die Marktmacher an, sondern folge ihnen", ist wohl der beste Rat, den ein Trader bekommen kann. Der TPA Indikator zeigt jedesmal seine Signale an wenn die Bullen definitiv stärker sind als die Bären und umgekehrt. Dieser Indikator wurde VON Tradern FÜR Trader gemacht und ist 100% NICHT NACHZEICHNEND! Signale werden STRENG am Schluss einer Kerze  generiert. Das sagen unsere Ku
Advanced Supply Demand MT5
Bernhard Schweigert
4.53 (15)
Derzeit 33% Rabatt! Die beste Lösung für jeden Anfänger oder erfahrenen Händler! Dieser Indikator ist ein einzigartiges, qualitativ hochwertiges und erschwingliches Trading-Tool, da wir eine Reihe von proprietären Funktionen und eine neue Formel integriert haben. Mit diesem Update werden Sie in der Lage sein, doppelte Zeitrahmenzonen anzuzeigen. Sie können nicht nur einen höheren TF (Zeitrahmen) anzeigen, sondern sowohl den Chart-TF als auch den höheren TF: SHOWING NESTED ZONES. Alle Supply Dema
Werden Sie Breaker Trader und profitieren Sie von Änderungen der Marktstruktur, wenn sich der Preis umkehrt. Der Order Block Breaker Indikator zeigt an, wann sich eine Trend- oder Preisbewegung der Erschöpfung nähert und bereit ist, sich umzukehren. Es weist Sie auf Änderungen in der Marktstruktur hin, die normalerweise auftreten, wenn eine Umkehrung oder ein größerer Rückzug bevorsteht. Der Indikator verwendet eine proprietäre Berechnung, die Ausbrüche und Preisdynamik identifiziert. Jedes
ICT, SMC, SMART MONEY CONCEPTS, SMART MONEY, Smart Money Concept, Support and Resistance, Trend Analysis, Price Action, Market Structure, Order Blocks, BOS/CHoCH,   Breaker Blocks ,  Momentum Shift,   Supply&Demand Zone/Order Blocks , Strong Imbalance,   HH/LL/HL/LH,    Fair Value Gap, FVG,  Premium  &   Discount   Zones, Fibonacci Retracement, OTE, Buy Side Liquidity, Sell Side Liquidity, BSL/SSL Taken, Equal Highs & Lows, MTF Dashboard, Multiple Time Frame, BigBar, HTF OB, HTF Market Structure
Matrix Arrow Indicator MT5
Juvenille Emperor Limited
5 (14)
Matrix Arrow Indicator MT5   ist ein einzigartiger 10-in-1-Trend, der zu   100 % nicht neu gezeichnet   werden kann. Multi-Timeframe-Indikator, der für alle Symbole/Instrumente verwendet werden kann:   Forex ,   Rohstoffe ,   Kryptowährungen ,   Indizes ,   Aktien .  Der  Matrix Arrow Indicator MT5  wird den aktuellen Trend in seinen frühen Stadien bestimmen und Informationen und Daten von bis zu 10 Standardindikatoren sammeln, die sind: Durchschnittlicher Richtungsbewegungsindex (ADX) Rohstoff
IX Power MT5
Daniel Stein
5 (3)
IX Power   bringt die unschlagbare Präzision von FX Power endlich auch zu Nicht-Forex-Symbolen. Es bestimmt präzise die Intensität von kurz-, mittel- und langfristigen Trends in Ihren Lieblingsindizes, Aktien, Rohstoffen, ETFs und sogar Kryptowährungen. Sie können   alles analysieren, was   Ihr Terminal zu bieten hat. Probieren Sie es aus und erleben Sie, wie   sich Ihr Timing   beim Handel   deutlich verbessert . IX Power Hauptmerkmale 100% präzise, nicht nachpinselnde Berechnungsergebni
Bill Williams Advanced
Siarhei Vashchylka
5 (7)
Bill Williams Advanced is designed for automatic chart analysis using Bill Williams' "Profitunity" system. The indicator analyzes four timeframes at once. Manual (Be sure to read before purchasing) Advantages 1. Automatically analyzes the chart using the "Profitunity" system of Bill Williams. The found signals are placed in a table in the corner of the screen. 2. Equipped with a trend filter based on the Alligator indicator. Most of the system signals are recommended to be used only accordi
Auto Order Block with break of structure based on ICT and Smart Money Concepts (SMC) Futures Break of Structure ( BoS )             Order block ( OB )            Higher time frame Order block / Point of Interest ( POI )    shown on current chart           Fair value Gap ( FVG ) / Imbalance   -  MTF      ( Multi Time Frame )    HH/LL/HL/LH  -  MTF      ( Multi Time Frame )  Choch  MTF      ( Multi Time Frame )  Volume Imbalance     ,  MTF          vIMB Gap’s Power of 3 Equal High
Dieses Dashboard zeigt die   neuesten verfügbaren harmonischen   Muster für die ausgewählten Symbole, so dass Sie Zeit sparen und effizienter sein werden /   MT4-Version . Kostenloser Indikator:   Basic Harmonic Pattern Spalten des Indikators Symbol:   die ausgewählten Symbole werden angezeigt Trend:   bullish oder bearish Pattern :   Art des Musters (Gartley, Schmetterling, Fledermaus, Krabbe, Hai, Cypher oder ABCD) Entry :   Einstiegskurs SL:   Stop-Loss-Kurs TP1:   1. Take-Profit-Kurs
Wir stellen vor       Quantum Breakout PRO   , der bahnbrechende MQL5-Indikator, der die Art und Weise, wie Sie mit Breakout-Zonen handeln, verändert! Entwickelt von einem Team erfahrener Händler mit über 13 Jahren Handelserfahrung,       Quantum Breakout PRO       ist darauf ausgelegt, Ihre Handelsreise mit seiner innovativen und dynamischen Breakout-Zone-Strategie auf ein neues Niveau zu heben. Der Quantum Breakout Indicator zeigt Ihnen Signalpfeile auf Breakout-Zonen mit 5 Gewinnzielzone
Legacy of Gann for MT5
Pavel Zamoshnikov
5 (6)
The indicator very accurately determines the levels of the possible end of the trend and profit fixing. The method of determining levels is based on the ideas of W.D.Gann, using an algorithm developed by his follower Kirill Borovsky. Extremely high reliability of reaching levels (according to K. Borovsky  - 80-90%) Indispensable for any trading strategy – every trader needs to determine the exit point from the market! Precisely determines targets on any timeframes and any instruments (forex, met
SMCpro
Arief
5 (1)
Currently Price  20% OFF  ( for unlimited use ) Indicator   USER MANUAL , trade setups, solving issues, etc :  Direct Download Here     (  for users only  ) Hello World! Introducing.. SMCpro tool and Indicator for  MetaTrader 5 , a cutting-edge feature designed to revolutionize your trading experience. With innovative ICT Smart Money Concept, you gain unparalleled insight into market dynamics, empowering you to make informed trading decisions like never before. SMC Indicator built on th
Gartley Hunter Multi
Siarhei Vashchylka
5 (7)
Gartley Hunter Multi - An indicator for searching for harmonic patterns simultaneously on dozens of trading instruments and on all possible timeframes. Manual (Be sure to read before purchasing) | Version for MT4 Advantages 1. Patterns: Gartley, Butterfly, Shark, Crab. Bat, Alternate Bat, Deep Crab, Cypher 2. Simultaneous search for patterns on dozens of trading instruments and on all possible timeframes 3. Search for patterns of all possible sizes. From the smallest to the largest 4. A
Volume by Price MT5
Brian Collard
4.2 (5)
The Volumebyprice.com Indicator for MetaTrader 5 features Volume Profile and Market Profile TPO (Time Price Opportunity). Volume and TPO histogram bar and line charts. Volume Footprint charts. TPO letter and block marker collapsed and split structure charts. Static, dynamic and flexible range segmentation and compositing methods with relative and absolute visualizations. Session hours filtering and segment concatenation with Market Watch and custom user specifications. Graphical layering, posit
Easy By Sell is a market indicator for opening and closing positions. It becomes easy to track market entries with alerts. It indicates trend reversal points when a price reaches extreme values ​​and the most favorable time to enter the market. it is as effective as a Fibonacci to find a level but it uses different tools such as an algorithm based on ATR indicators and Stochastic Oscillator. You can modify these two parameters as you wish to adapt the settings to the desired period. My othe
AW Trend Predictor MT5
AW Trading Software Limited
4.78 (58)
Die Kombination von Trend- und Aufschlüsselungsebenen in einem System. Ein fortschrittlicher Indikatoralgorithmus filtert Marktrauschen, bestimmt den Trend, Einstiegspunkte sowie mögliche Ausstiegsniveaus. Indikatorsignale werden in einem Statistikmodul aufgezeichnet, das es Ihnen ermöglicht, die am besten geeigneten Tools auszuwählen, die die Wirksamkeit der Signalhistorie zeigen. Der Indikator berechnet Take-Profit- und Stop-Loss-Marken. Handbuch und Anleitung ->   HIER   / MT4-Version ->   H
Owl Smart Levels MT5
Sergey Ermolov
4.39 (38)
MT4-Version  |  FAQ Der Owl Smart Levels Indikator ist ein komplettes Handelssystem innerhalb eines Indikators, der so beliebte Marktanalysetools wie die fortschrittlichen Fraktale von Bill Williams , Valable ZigZag, das die richtige Wellenstruktur des Marktes aufbaut, und Fibonacci-Levels , die die genauen Einstiegslevels markieren, enthält in den Markt und Orte, um Gewinne mitzunehmen. Detaillierte Strategiebeschreibung Anleitung zur Verwendung des Indikators Berater-Assistent im Handel Owl H
Weitere Produkte dieses Autors
Spread Actual
Abdelkhabir Yassine Alaoui
This indicator Displays current spread in the main window of the chart. You can modify the font parameters, indicator's position and the normalization of the spread value. The spread is redrawn after each tick, ensuring the most current and active spread value. This can be useful for brokers with variable spreads or with spreads that are widened often. You can also enable a spread label to be shown near the current Bid line. you can also set  alert : Email, and push notifications.
Usdjpy Hunter
Abdelkhabir Yassine Alaoui
This is a classic trading strategy based on two Moving Averages crossover. customized for usdjpy with a Good risk management strategy RR 1/2 . (    Long when fast MA crosses slow MA from below and Short when fast MA crosses slow MA from above ) TF : 5MIN MAX Lot size to use : 2% e.g : Balance =100 => lot size = 0.02 Balance =1000 => lot size = 0.20 Balance =10000 => lot size = 2 ------
FREE
Basing Candles
Abdelkhabir Yassine Alaoui
Basing Candles indicator is an automatic indicator that detects and marks basing candles on the chart. A basing candle is a candle with body length less than 50% of its high-low range. A basing candle or basing candlestick is a trading indicator whose body length is less than half of its range between the highs and lows. That's less than 50% of its range. The indicator highlights the basing candles using custom candles directly in the main chart of the platform. The percentage criterion can be
FREE
Volume Profile For MT5
Abdelkhabir Yassine Alaoui
Volume Profile is a very useful indicator . it allows you to spot the price levels where important price action took place. It is similar to support and resistance levels but with a different logic. ( Check Out  Fixed Range Volume Profile MT5  ) One of the first thing that traders mark up when analyzing a chart is support and resistance. Volume Profile can be used for doing that too. The indicator scans the defined number of previous bars and calculates the volume of activity at each price
DXY Correlation
Abdelkhabir Yassine Alaoui
Der Indikator kann für den DXY-Korrelationshandel verwendet werden. Es berechnet den Dollar-Index (USDX oder DXY) anhand der Währungspaare XAU/USD, EUR/USD, USD/JPY, GBP/USD, USD/CAD, USD/CHF und USD/SEK. Um mit ihnen zu handeln, müssen Sie ein bestätigtes technisches Analysemuster auf dem DXY-Chart finden und nach einem korrelierten Währungspaar suchen, dessen Preisdiagramm das gleiche Bild aufweist.
Best Pivot Point Indicator  display   pivot points   and   support and resistance   lines for the intraday trading. It calculates them using its own formula based on the previous trading session The indicator can display the following levels in addition to plain pivot points: Previous session's High and Low, today's Open. Sweet spots. Fibonacci levels. Camarilla pivots. Midpoint pivots.
Support And Resistance indicator that can display round levels and zones . It shows them directly on the chart, providing an easy help when you want to set stop-loss or take-profit level, or when you want to see the next market target.   If an asset price is moving down and bounces back up, the level is called support (think: price floor). If an asset price is moving upward and hits a level where it reverses downward, this is called resistance (think: price ceiling).
Seconds Timeframes Chart MT5
Abdelkhabir Yassine Alaoui
Sekundendiagramm für MetaTrader 5 Mit den Indikatoren können Sie im MetaTrader 5-Terminal Diagramme mit einem Zeitrahmen in Sekunden erstellen. Der Zeitrahmen in einem solchen Diagramm wird in Sekunden festgelegt, nicht in Minuten oder Stunden. Somit können Sie Diagramme mit einem Zeitrahmen von weniger als M1 erstellen. S15 ist beispielsweise ein Zeitrahmen mit einer Periode von 15 Sekunden. Sie können Indikatoren, Expert Advisors und Skripte auf das resultierende Diagramm anwenden. Sie er
Auswahl:
Anton du
23
Anton du 2024.03.27 18:52 
 

it xdoes not work and there is no contact

Abdelkhabir Yassine Alaoui
2918
Antwort vom Entwickler Abdelkhabir Yassine Alaoui 2024.04.01 13:54
it work , you just you don't know how to use it ( Certain brokers don't provide volume data . this indicator won't work if there no volume data provided from the broker server )
fred6531
14
fred6531 2023.04.27 11:18 
 

Der Benutzer hat keinen Kommentar hinterlassen

Sarah
25
Sarah 2023.04.27 10:33 
 

Der Benutzer hat keinen Kommentar hinterlassen

Antwort auf eine Rezension
Version 1.2 2024.04.01
Fixed Range Selection Tool