Top Bottom Indicator
- Indikatoren
- Zhi Xian Hou
- Version: 1.0
- Aktivierungen: 10
Einführung in den Indikator
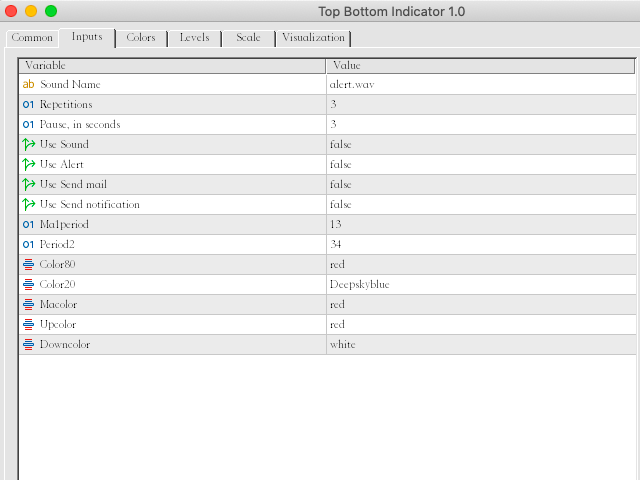
Der Indikator basiert auf Formeln für gleitende Durchschnitte, die stabiler sind und weniger Verzögerungen aufweisen als RSI oder CCI. Der Indikator verfügt über drei Indikatorwerte, die Periode des gleitenden Durchschnitts und die Farben der Linie können manuell geändert werden.
Was kann Ihnen dieser Indikator bringen?
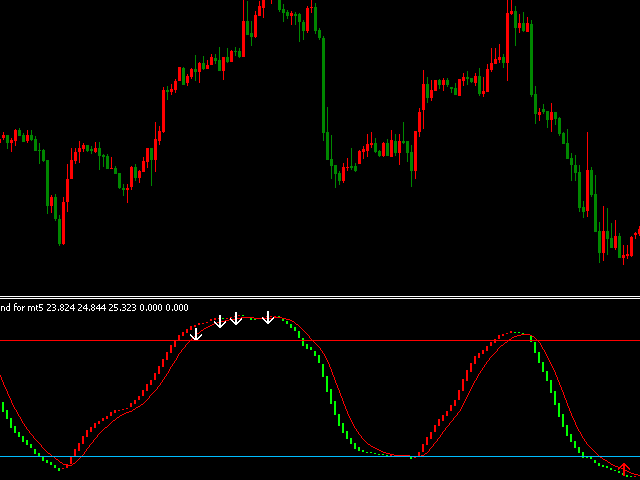
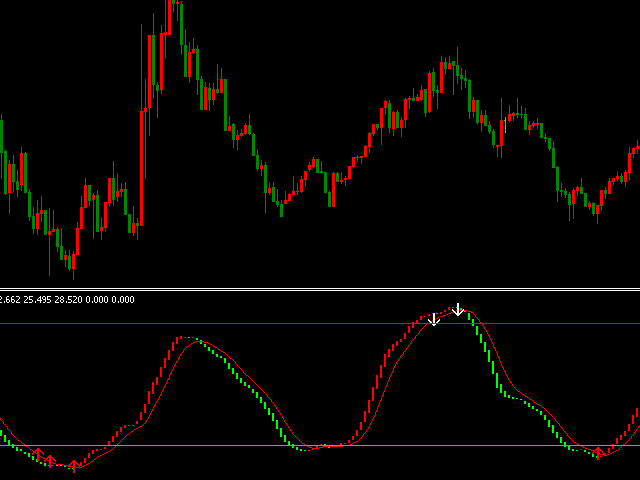
- Präzise Einstiegssignale: Der Indikator zeichnet Auf- und Ab-Pfeilsignale.
- Mehrperioden-Trendanalyse: Wenn Sie diesen Indikator in ein großes Zeitrahmendiagramm und ein kleines Zeitrahmendiagramm laden, ist die Wirkung seiner Verwendung besser. Beurteilen Sie die Trendrichtung anhand der Indikatorfarbe auf dem großen Zeitrahmendiagramm und steigen Sie anhand der Signale auf einem kleinen Zeitrahmendiagramm in den Markt ein.
- Beurteilung des Abschnitts „hoher Preis“ und „niedriger Preis“: Der Wert des Indikators liegt immer zwischen 0 und 100, auf dieser Grundlage kann die relative Position des Preises analysiert werden. Wenn die Trendlinie höher als 80 ist, befindet sich der Preis in einem überkauften Bereich. Sie können Gelegenheiten zum Eröffnen von Kaufpositionen wählen. Wenn die Trendlinie unter 20 liegt, befindet sich der Preis in einem überverkauften Bereich . Sie können Gelegenheiten zum Öffnen von Verkaufspositionen wählen.
- Entwerfen neuer EAs: Sie können neue EAs basierend auf der Richtung der Trendlinie oder der Divergenz des Indikators entwerfen .
- Alarme: Wenn es Aufwärts- oder Abwärtspfeilsignale gibt oder zwei Linien über 80 und ein Aufwärtskreuz oder haben Wenn Sie unter 20 liegen und ein Abwärtskreuz haben , können Sie E-Mails und Nachrichten an den mobilen Client senden und gleichzeitig Warnungen im Kartenfenster senden, sodass Sie sofort Signale erhalten, ohne die Signale ständig selbst beobachten zu müssen. Die Anzahl der Erinnerungswiederholungen jedes Mal kann manuell geändert werden, und die drei Arten von Nachrichtenerinnerungen können manuell ein- oder ausgeschaltet werden.
- Der Indikator zeichnet Trendlinien auf einfache und intuitive Weise und ist einfach zu bedienen.
- Die Preise sind gut vorhersagbar und der Wert des Indikators liegt immer zwischen 0 und 100, wodurch der relativ hohe oder niedrige Preis vorhergesagt werden kann.
- Robust, ohne häufige Trendsignalumkehr;
- Mit geringer Verzögerung ist es möglich, die Trendlinienfarben in der Anfangsphase der Preisumkehr zu ändern;
- Anwendbar auf alle Zeitrahmen und alle Symbole;
- Trendlinien und Pfeilsignale verschieben sich nicht und werden nicht neu gezeichnet.
Der Indikator ist in den folgenden Abbildungen dargestellt. Sie können den Indikator herunterladen und auf MT5-Terminals erneut testen.