TrafficLight
- Indikatoren
- Stanislav Korotky
- Version: 1.4
- Aktualisiert: 22 November 2021
- Aktivierungen: 5
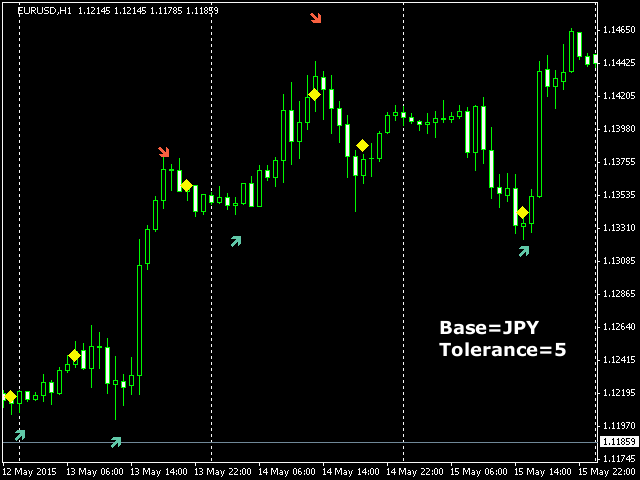
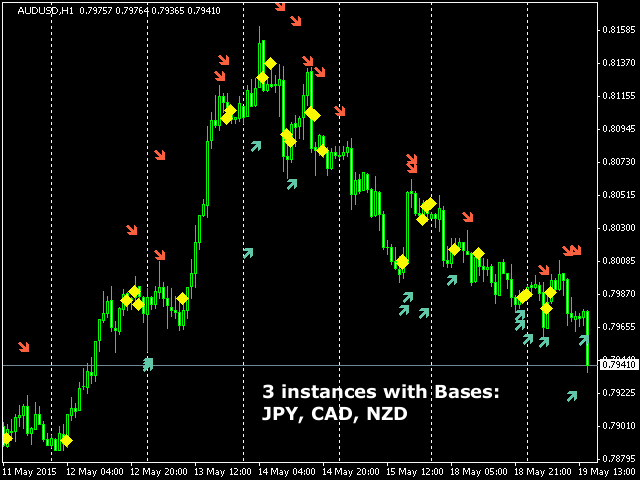
TrafficLight provides simple trading buy and sell signals. The indicator shows reversal points and ambiguous points on current chart using cross rates. Only completed bars are counted. Buys are denoted by green arrows, sells - by red arrows. Yellow diamonds denote bifurcation points.
Distance to the arrows relatively to the current price is a measure of volatility on the cross rates, and can be used as future price movement estimate for the work symbol.
Due to the fact that indicator is calculated using two different symbols (and not the work symbol itself), please make sure that both of them are selected in Market Watch and their required data is downloaded after the first time you drop the indicator on a chart; if signals are missing on the chart or there is a gap in the ending part, please, reopen the dialog with indicator properties and click OK again - the data will be, most likely, available, and the indicator will display its signals.
Parameters
- MaxBar - number of bars for processing, default value is 1000;
- Base - base currency for cross rates (JPY by default) which is ok, for example, for EURUSD as a work symbol; one should enter a currency, which differs to any of two currencies of the work symbol; also please make sure you enter a currency for which both cross rates exist; for example, the demo server lacks GBPAUD/AUDGBP, therefore it's impossible to get signals on the AUDUSD chart using GBP as Base; missing symbols are reported to the log;
- Tolerance - maximal distance in bars between signals on two cross rates, which is allowed for generation of signals on the work symbol, default value is 3; the larger the value, the larger the number of signals you get, but the larger their inconsistency; value 0 means minimum number of signals, but it guarantees complete coincidence of signals on crosses;
How to Trade Using this Indicator
Buy and sell signals are formed on the 1-st bars at the moment of their completion, that is on the very first tick on a new zero bar. Open an order in the direction of the signal, and place initial stop-loss on the price level, there the mark resides. If the distance is too large according to your risk management, abstain from the entrance. Sometimes both buy and sell signals are formed on the same bar. This indicates that situation on the crosses contradicts each other. Do not enter the market in such conditions.
Trail stop loss for the opened position. If a yellow diamond appears on next bars, it's an opportunity to revise your position. If the price of the mark is worse than current price, move stop loss to the price of the mark. If current price is worse than the mark, consider closing position instantly.
It's recommended to place on the chart multiple instances of the indicator with different Base values. Then, take a decision based on the signals of the majority of instances - check, if consistent signals are shown on several latest bars and trade in this direction.
All timeframes are applicable. It makes sense to filter signals by time of day and forthcoming news for mid-term, intraday trading (M15 - H1).
