Nyse Usdxy
- Indikatoren
- Mitchell Dean Ede
- Version: 1.0
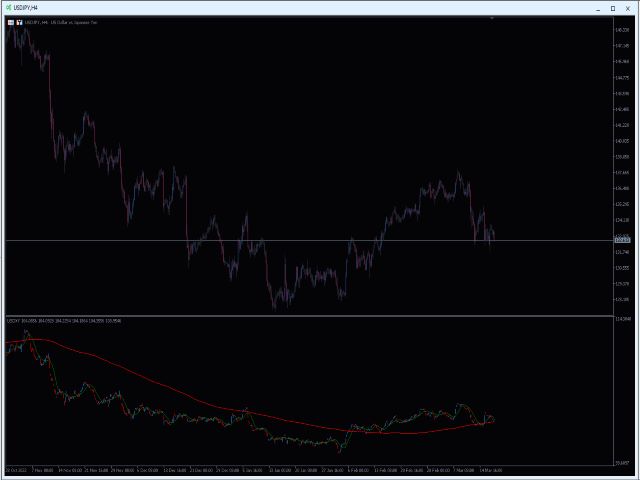
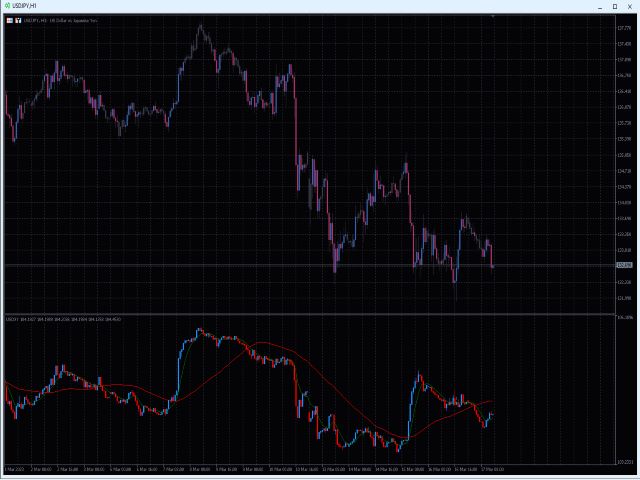
Displays a USD DXY chart in a seperate window below the main chart.
YOUR BROKER MUST HAVE THESE SYMBOLS FOR THE INDICATOR TO WORKBased on EUR/USD, USD/JPY, GBP/USD, USD/CAD, USD/CHF and USD/SEK
All these pairs must be added to Market Watch for the indicator to work correctly
As this is calculated using a formula based on the 6 pairs it will only work when the market is open.
YOUR BROKER MUST HAVE THESE SYMBOLS FOR THE INDICATOR TO WORK
Displays a USD DXY chart in a seperate window below the main chart.
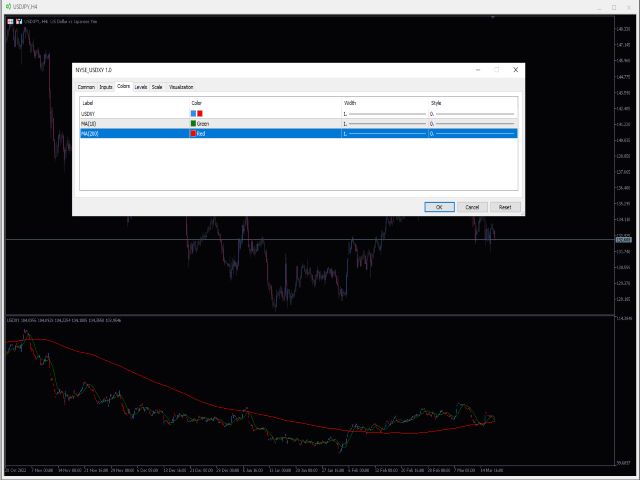
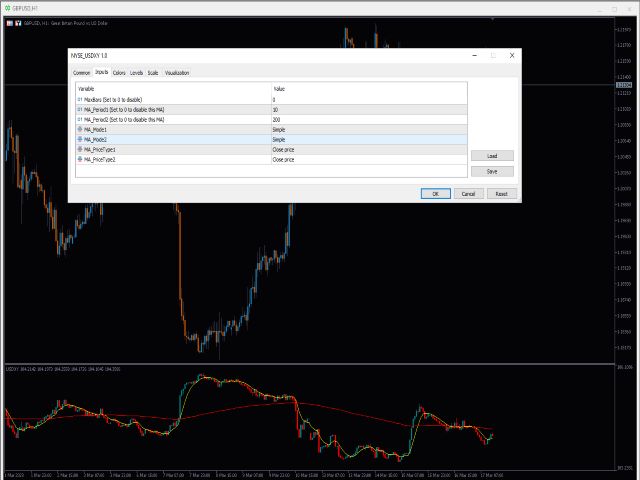
There are 2 optional moving averages.This is useful in spotting moving average cross overs on the USD index whilst analysing direction for USD pairs.
very good!