Auto Fibo Retracement MT5
- Indikatoren
- Nguyen Tuan Son
- Version: 1.2
- Aktualisiert: 22 März 2023
Just another Auto Fibonacci Retracement indicator. However, this is the most Flexible & Reliable one you can find for FREE. If you use this indicator and you like it, please leave a review/comment.
If you are looking for a more advanced Fibo indicator, check this Free Trend-Based Fibo indicator.
### FEATURES ###
- Auto-calculate up to 7 Fibonacci levels on your customized frame.
- Adjust levels as your need.
- Use High/Low price or Open/Close price to calculate.
- Freeze the levels and don't recalculate when chart moves.
- Keep the starting point and recalculate the ending point when chart moves.
- Auto-Recalculate everything in a fixed frame.
- Set up the style (Line color, line style and line thickness) of each Fibonacci level to easy to see.
- Extend the right and/or left side of lines to easy to use.
- Move the position of level info (Level and its value) to Right or Left.
- Show/Hide level value.
### SETTINGS ###
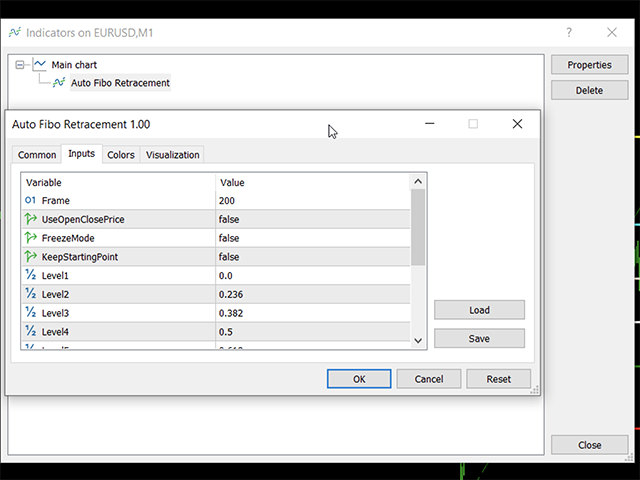
- Frame: Your custom frame to calculate Fibo levels. It's the number of candles to look back.
- UseOpenClosePrice: Set to True to use the Open/Close price to calculate instead of High/Low price. This helps to reduce noisy signals in some cases. Please note: This mode may recalculate and redraw the levels in some cases. It's right, not bug.
- FreezeMode: Set to True to freeze the Fibo levels as initialize. It'll not recalculate the levels when chart moves.
- KeepStartingPoint: Set to True to keep the starting point of frame. This helps to NOT move the first point of levels when the number of bars from the first bar to the current bar is more than the Frame set up. Please note: If the main trend direction is changed (from bearish to bullish or bullish to bearish), the starting point will be updated to capture the latest trend.
- Level1 to Level7: 7 Fibonacci levels you want to calculate. Set to a number less than 0 to hide that level.
- ExtendLeft: Set to True to draw levels to the most left of the chart (by default, it starts from the beginning of the main trend).
- ExtendRight: Set to True to draw levels to the most right of the chart (by default, it end from the ending of the main trend).
- ShowLevelPrice: Set to True to show the price next to the level.
- InfoOnLeft: Set to true to move the level info to the left of levels.
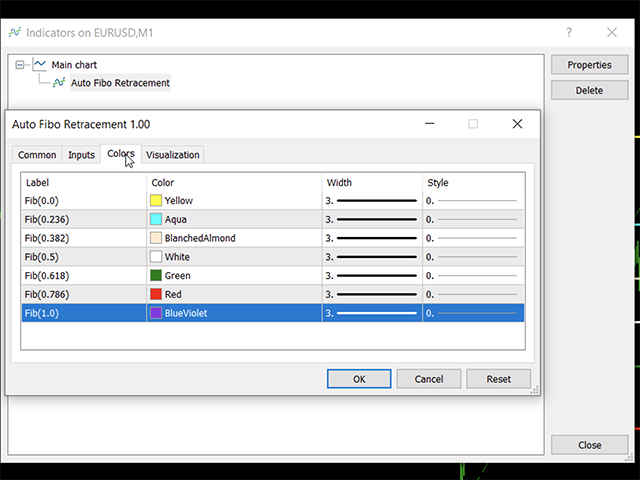
- Colors tab: Move to color tab to change Color, Style and Width of each level as your preferred.
### HOW TO USE IT ###
Just click on the indicator name to attach the indicator to the chart. You can change settings as you need. The meaning of each setting is as above.
### WHAT'S IN THE CHART ###
When the indicator is attached to the chart, you will see:
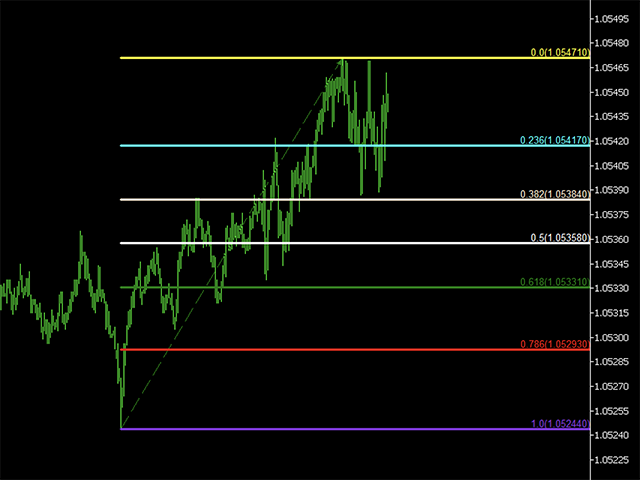
- The line arrow is the main trend. It is from the start to the end of the trend. Green if the main trend is bullish and red if the main trend is bearish.
- 7 horizon lines in difference colors are the Fibonacci levels.
- Text on the line is the level and the price on that level.
If you need further support, please feel free to leave a comment.





It is reliable and find it accurate 90% of the time. I would love if the developer can help me to customize it according according to my needs to change the coordinates. I use fib 100% of the time in my trading.