• Übersicht
  • Bewertungen
  • Diskussion

Rait Patterns PinBar

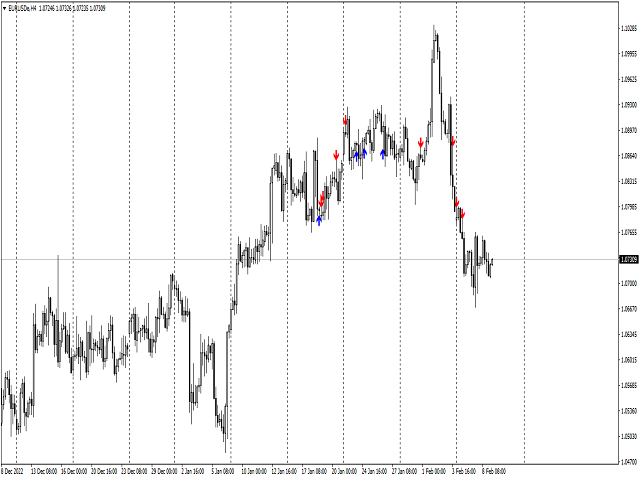
Современный индикатор паттернов PinBar по торговой стратегии RAIT.

Работает по тренду и без него.

Имеет настройки таймфрейма для отображения.

Можно настроить количество баров для отображения индикатора на графике.

Используется несколько паттернов PinBar.

Индикатор предпочтительно использовать на часовом таймфрейме и выше, но работает и ниже .

Паттерны:  PinBar, InsPinBar, PinInside.

Отображаются одной стрелкой.


Empfohlene Produkte
VR Cub
Vladimir Pastushak
VR Cub ist ein Indikator für den Erhalt hochwertiger Einstiegspunkte. Der Indikator wurde entwickelt, um mathematische Berechnungen zu erleichtern und die Suche nach Einstiegspunkten in eine Position zu vereinfachen. Die Handelsstrategie, für die der Indikator geschrieben wurde, hat sich seit vielen Jahren bewährt. Ihr großer Vorteil liegt in der Einfachheit der Handelsstrategie, die es auch unerfahrenen Händlern ermöglicht, erfolgreich damit zu handeln. VR Cub berechnet Positionseröffnungspunkt
Owl smart levels
Sergey Ermolov
4.58 (55)
MT5-Version  |  FAQ Der   Owl Smart Levels Indikator   ist ein komplettes Handelssystem innerhalb eines Indikators, der so beliebte Marktanalysetools wie die   fortschrittlichen Fraktale von Bill Williams , Valable ZigZag, das die   richtige Wellenstruktur   des Marktes aufbaut, und   Fibonacci-Levels , die die genauen Einstiegslevels markieren, enthält in den Markt und Orte, um Gewinne mitzunehmen. Detaillierte Strategiebeschreibung Anleitung zur Verwendung des Indikators Berater-Assistent im
The indicator detects and displays М. Gartley's Butterfly pattern. The pattern is plotted by the extreme values of the ZigZag indicator (included in the resources, no need to install). After detecting the pattern, the indicator notifies of that by the pop-up window, a mobile notification and an email. The pattern and wave parameters are displayed on the screenshots. The default parameters are used for demonstration purposes only in order to increase the amount of detected patterns. Parameters
Trend Ray
Andriy Sydoruk
The indicator shows the potential trend direction by cyclical-wave dependence. Thus, all the rays of the intersection will be optimal rays, in the direction of which the price is expected to move, taking into account the indicator period. Rays can be used as a direction for potential market movement. But we must not forget that the approach must be comprehensive, the indicator signals require additional information to enter the market.
The main idea of this indicator is rates analysis and prediction by Fourier transform. Indicator decomposes exchange rates into main harmonics and calculates their product in future. You may use the indicator as a standalone product, but for better prediction accuracy there is another related indicator - FreqoMaster - which uses FreqoMeterForecast as a backend engine and combines several instances of FreqoMeterForecast for different frequency bands. Parameters: iPeriod - number of bars in the ma
The indicator detects and displays 3 Drives harmonic pattern (see the screenshot). The pattern is plotted by the extreme values of the ZigZag indicator (included in the resources, no need to install). After detecting the pattern, the indicator notifies of that by a pop-up window, a mobile notification and an email. The indicator highlights the process of the pattern formation and not just the complete pattern. In the former case, it is displayed in the contour triangles. After the pattern is com
Trend PA
Mikhail Nazarenko
5 (3)
The Trend PA indicator uses   Price Action   and its own filtering algorithm to determine the trend. This approach helps to accurately determine entry points and the current trend on any timeframe. The indicator uses its own algorithm for analyzing price changes and Price Action. Which gives you the advantage of recognizing, without delay, a new nascent trend with fewer false positives. Trend filtering conditions can be selected in the settings individually for your trading style. The indicator
Basierend auf MACD-Indikatorwellen mit Standardparametern Wendet Fibonacci-Werte auf die letzten beiden MACD-Wellen an, jeweils positiv und negativ, wenn der MACD-Indikator im Moment keine negative Welle mehr hat - die Farbe ist grün, wenn der MACD-Indikator im Moment keine positive Welle mehr hat - die Farbe ist rot. Das Wave-Abschlusskriterium sind zwei Ticks mit unterschiedlichem MACD-Zeichen. Wendet Trendlinien auf die letzten vier MACD-Wellen an. Arbeitet gut mit dem Experten zus
Der Trendfänger: Die Strategie des Trendfängers mit Alarmindikator ist ein vielseitiges technisches Analysewerkzeug, das Händlern hilft, Markttrends und potenzielle Ein- und Ausstiegspunkte zu identifizieren. Sie verfügt über eine dynamische Trendfängerstrategie, die sich den Marktbedingungen anpasst, um eine klare visuelle Darstellung der Trendrichtung zu ermöglichen. Händler können die Parameter an ihre Vorlieben und Risikotoleranz anpassen. Der Indikator hilft bei der Trendidentifikation,
FREE
MACD Divergence Finder Indicator will help you to find Divergences between your typical MACD values and the Chart Prices as potential points of actual Trend Reversion or Pull Backs to increase your positions as per the current Trend. Indicator Windows draws MACD value and Divergence arrows but not MACD Signal as it is not considered relevant to detect this kind of Classic Divergences. In some computer/VPS with old microprocessors or low RAM size, when you launch this Indicator (attach it, change
The indicator detects and displays Shark harmonic pattern (see the screenshot). The pattern is plotted by the extreme values of the ZigZag indicator (included in the resources, no need to install). After detecting the pattern, the indicator notifies of that by a pop-up window, a mobile notification and an email. The indicator highlights the process of the pattern formation and not just the complete pattern. In the former case, it is displayed in the contour triangles. After the pattern is comple
Forex Indicator "Support Resistance Levels" for MT4 Indicator " Support Resistance Levels" is very useful auxiliary indicator for trading 'Support' and 'Resistance' are important zones on chart respected by price Support level is where the price regularly stops falling and bounces back up Resistance level is where the price normally stops rising and dips back down I ndicator " Support Resistance Levels" shows the recent levels: Resistance  levels - red lines.  S upport  levels - blue lines
Forex Indicator HTF Ichimoku for MT4 Ichimoku indicator is   one of the most powerful trend indicators .  H TF means -   H igher Time Frame This indicator is excellent for Trend Traders as well as combination with Price Action entries. HTF Ichimoku  Indicator allows you to attach Ichimoku from Higher time frame to your current chart. Up trend   - red line above blue one (and both lines are above cloud) /   Down trend   - red line below blue one  (and both lines are below cloud) Open BUY orders
Der Indikator baut einen Fächer von Trendlinien auf (nach dem Klicken auf eine bestimmte Kerze), ähnlich den klassischen Gann-Winkeln. Die Besonderheit des Indikators besteht darin, dass er Winkel nicht nur auf einer festen Skala aufbaut, sondern auch den Durchschnittspreis einer bestimmten Anzahl von Balken verwendet (optional). Es gibt zwei Möglichkeiten, den Durchschnittspreis für Winkel im Indikator zu berechnen (optional): 1) Berechnung der durchschnittlichen Preisbewegung (für eine b
Trend Scanner
Vladimir Kalendzhyan
4.38 (8)
By purchasing this indicator, you have the right to receive a free copy of one of   my other indicator's or advisor’s!  (All future updates are included. No limits) . To get it , please contact me by  mql5 message ! The Trend Scanner trend line indicator displays the trend direction and its changes. The indicator works on all currency pairs and  timeframes. The indicator simultaneously displays multiple readings on the price chart: the support and resistance lines of the currency pair, the exist
Noize Absorption Index MT4
Ekaterina Saltykova
5 (1)
Noize Absorption Index - is the manual trading system that measures the difference of pressure between bears forces and bulls forces. Green line - is a noize free index that showing curent situation. Zero value of index shows totally choppy/flat market.Values above zero level shows how powerfull bullish wave is and values below zero measures bearish forces.Up arrow appears on bearish market when it's ready to reverse, dn arrow appears on weak bullish market, as a result of reverse expectation. S
The indicator displays the data of the Stochastic oscillator from a higher timeframe on the chart. The main and signal lines are displayed in a separate window. The stepped response is not smoothed. The indicator is useful for practicing "manual" forex trading strategies, which use the data from several screens with different timeframes of a single symbol. The indicator uses the settings that are identical to the standard ones, and a drop-down list for selecting the timeframe. Indicator Parame
Trendiness Index
Libertas LLC
5 (3)
"The trend is your friend" is one of the best known sayings in investing, because capturing large trendy price movements can be extremely profitable. However, trading with the trend is often easier said than done, because many indicators are based on price reversals not trends. These aren't very effective at identifying trendy periods, or predicting whether trends will continue. We developed the Trendiness Index to help address this problem by indicating the strength and direction of price trend
TrendPlus
Sivakumar Subbaiya
4.21 (14)
Trend Plus   Trendplus  Indicator   Time Frame: Suitable for any time frame.  Purpose: Trend Prediction. Blue and red candle indicate the buy and sell call respectively. Buy: When the blue candle is formed buy call is initiated. close the buy trades when the next red candle will formed.   Sell: When the Red candle is formed Sell call is initiated. close the Sell trades when the next blue candle will formed.   Happy trade!!
FREE
FreqoMaster
Stanislav Korotky
The main idea of this indicator is rates analysis and prediction by Fourier transform. The indicator decomposes exchange rates into main harmonics and calculates their product in future. The indicator shows 2 price marks in history, depicting price range in the past, and 2 price marks in future with price movement forecast. Buy or sell decision and take profit size are displayed in a text label in the indicator window. The indicator uses another indicator as an engine for calculations - FreqoMet
Free automatic Fibonacci is an indicator that automatically plots a Fibonacci retracement based on the number of bars you select on the BarsToScan setting in the indicator. The Fibonacci is automatically updated in real time as new highest and lowest values appears amongst the selected bars. You can select which level values to be displayed in the indicator settings. You can also select the color of the levels thus enabling the trader to be able to attach the indicator several times with differe
FREE
Forex Indicator "RSI and 2   Moving Averages"   for MT4 This indicator is excellent for   Momentum trading systems . " RSI and 2 MAs"   Indicator allows you to   see Fast and Slow Moving Averages of RSI itself Indicator gives opportunities to see the trend change very early " RSI and 2 MAs" can be used to catch the momentum into the trend direction It is very easy to set up this indicator via parameters (see the picture) Indicator can be used on any time-frame // More great Expert Advisors and I
This is a new strategy for SUPPLY DEMAND areas It is based on a calculation using the tick volume to detect the big price action in market for both bear /bull actions this smart volume action candles are used to determine the supply and demand areas prices in between main supply and demand lines indicate sideway market  up arrows will be shown when prices moves above the main supply and the secondary supply lines Down arrows will be shown when prices moves below the main demand and the secondary
Line Magnit
Aleksey Trenin
The LineMagnit Indicator for MT4 is a highly precise tool that builds support and resistance levels which magnetically attract prices. This feature allows traders to easily determine the most probable entry and exit points in the market, as well as identify the market's directional forces, as levels are based on capital inflows into the instrument. Equipped with an intuitively understandable graphical interface, the LineMagnit Indicator enables users to quickly locate and analyze support and res
Vortex MT4
KEENBASE SOFTWARE SOLUTIONS
The Vortex Indicator was first presented by Douglas Siepman and Etienne Botes in January 2010 edition of Technical Analysis of Stocks & Commodities. Despite its based on a complex implosion phenomenon, the vortex is quite simple to interpret. A bullish signal is generated when +VI line cross above the -VI line and vice versa. The indicator is mostly used as a confirmation for trend trading strategies. The Vortex was inspired by the work of Viktor Schauberger, who studied the flow of water in tur
This indicator is the undisputed leader among the indicators. And for this statement there is a good reason. The indicator builds a very high quality channel in which it generates signals to enter! What is the ideal strategy for the trader, since the trader always hesitates when choosing a strategy for the job. That is, this indicator will allow you to solve the dilemma of choosing a job by trend or to the channel, since it combines these two basic concepts. Working with the indicator is very
Power Renko is an indicator which plots Renko bricks underneath the chart using a histogram. You can select the brick size and the timeframe of the Renko bricks as well as whether or not to use the close price or the high/low price of the candles. Renko bricks are based on price alone, not time, therefor the Renko bricks will not be aligned with the chart's time. They are extremely useful for trend trading and many different strategies can be formed from them. Buffers are provided allowing you t
"Adjustable Fractals" - is an advanced version of fractal indicator, very useful trading tool! As we know   Standard fractals mt4 indicator does not have settings at all   - this is very inconvenient for traders Adjustable Fractals has resolved that issue - it has all necessary settings: Adjustable period   of indicator (recommended values - above 7) Adjustable distance   from Highs/Lows of price Adjustable design   af fractal arrows // More great Expert Advisors and Indicators are available he
Trend Monitor
Pavel Zamoshnikov
4.2 (5)
The indicator generates early signals basing on ADX reading data combined with elements of price patterns. Works on all symbols and timeframes. The indicator does not redraw its signals. You see the same things on history and in real time. For better visual perception signals are displayed as arrows (in order not to overload the chart). Features Easy to use. Filter configuration only requires selection of sensitivity in the " Sensitivity of the indicator " input. Signals can be filtered usin
Gold Phoenix
Yaroslav Varankin
The perfect tool for Scalng in the Forex markets You can trade both from signal to signal and using take profit  The algorithm does not use Zigzag!  No redrawing!  This is a channel instrument that uses a moving average as a filter. Moving Average  There are 2 parameters for the settings Ma Period = 5 period Moving Average  Channel 1.0 distance of channel lines from the chart Price Signal Filter - calculation of signal opening and filter There is a complete set of Alert There is a multi-timefram
Käufer dieses Produkts erwarben auch
Gann Made Easy
Oleg Rodin
4.88 (100)
Gann Made Easy ist ein professionelles und einfach zu bedienendes Forex-Handelssystem, das auf den besten Handelsprinzipien unter Verwendung der Theorie von Mr. basiert. W.D. Gann. Der Indikator liefert genaue KAUF- und VERKAUFSsignale, einschließlich Stop-Loss- und Take-Profit-Levels. Mit PUSH-Benachrichtigungen können Sie auch unterwegs handeln. Bitte kontaktieren Sie mich nach dem Kauf! Ich werde meine Handelstipps und tolle Bonusindikatoren kostenlos mit Ihnen teilen! Wahrscheinlich haben Si
Gold Stuff
Vasiliy Strukov
4.9 (270)
Gold Stuff-Ein Trendindikator, der speziell für Gold entwickelt wurde, kann auch auf allen Finanzinstrumenten verwendet werden. Der Indikator wird nicht neu gezeichnet und verzögert sich nicht. Empfohlener Zeitrahmen H1. Nach diesem Indikator geschrieben EA Gold Stuff Berater, können Sie es in meinem Profil finden. WICHTIG! Kontaktieren Sie mich sofort nach dem Kauf, um Anweisungen und Bonus zu erhalten!   Sie können eine kostenlose Kopie unseres Strong Support- und Trendscanner-Indikators
Trend Punch
Mohamed Hassan
4.91 (23)
This indicator is unstoppable when combined with our other indicator called  Support & Resistance . After purchase, send us a message and you will get it   for  FREE as a BONUS! Introducing Trend Punch , the revolutionary forex trend indicator that will transform the way you trade! Trend Punch is uniquely designed to provide precise buy and sell arrows during strong market trends, making your trading decisions clearer and more confident. Whether you're trading major currency pairs or exotic sym
BITTE LESEN SIE DIE INFORMATIONEN UNTEN, BEVOR SIE DAS PRODUKT KAUFEN! Apollo Pips PLUS SP ist ein einzigartiges Produkt! ES IST FÜR ALLE, DIE MEINEN NEUEN „APOLLO PIPS“-INDIKATOR PLUS „SUPER PACK“-BONUS MIT ZUGRIFF AUF ALLE MEINE HANDELSINDIKATOREN ERHALTEN MÖCHTEN! Mit dem Kauf des Produkts Apollo Pips PLUS SP erwerben Sie tatsächlich eine völlig neue Version meines Apollo Pips-Indikators. Diese Version des Indikators verfügt über einen verbesserten Algorithmus und einen benutzerfreundlichen P
Scalper Inside PRO
Alexey Minkov
4.75 (60)
An exclusive indicator that utilizes an innovative algorithm to swiftly and accurately determine the market trend. The indicator automatically calculates opening, closing, and profit levels, providing detailed trading statistics. With these features, you can choose the most appropriate trading instrument for the current market conditions. Additionally, you can easily integrate your own arrow indicators into Scalper Inside Pro to quickly evaluate their statistics and profitability. Scalper Inside
Trend Pulse
Mohamed Hassan
5 (5)
Please contact me after purchase to immediately get your PDF strategy + documentation for Trend Pulse !  Official release price of $89  (2 /50 copies left). Next price is $199 . Introducing Trend Pulse , a unique and robust indicator capable of detecting bullish, bearish, and even ranging trends! Trend Pulse uses a special algorithm to filter out market noise with real precision. If the current symbol is moving sideways, Trend Pulse will send you a ranging signal, letting you know that it'
FX Power MT4 NG
Daniel Stein
5 (12)
Erhalten Sie Ihr tägliches Marktupdate mit Details und Screenshots über unser Morning Briefing hier auf mql5 und auf Telegram ! FX Power MT4 NG ist die nächste Generation unseres langjährig sehr beliebten Währungsstärkemessers FX Power. Und was bietet dieser Stärkezähler der nächsten Generation? Alles, was Sie am ursprünglichen FX Power geliebt haben PLUS GOLD/XAU-Stärkeanalyse Noch präzisere Berechnungsergebnisse Individuell konfigurierbare Analysezeiträume Anpassbares Berechnungslimit für noc
TPSproTREND PrO
Roman Podpora
4.79 (19)
TPSpro TREND PRO   ist ein Trendindikator, der den Markt automatisch analysiert und Informationen über den Trend und jede seiner Änderungen liefert sowie Signale für den Einstieg in Geschäfte ohne Neuzeichnung gibt! Der Indikator verwendet jede Kerze und analysiert sie separat. bezieht sich auf verschiedene Impulse – Aufwärts- oder Abwärtsimpuls. Exakte Einstiegspunkte in Transaktionen für Währungen, Krypto, Metalle, Aktien, Indizes! Version MT5                   VOLLSTÄNDIGE BESCHREIBUNG DES
Atomic Analyst
Issam Kassas
5 (3)
Zunächst einmal ist es erwähnenswert, dass dieser Handelsindikator nicht neu malt, nicht neu zeichnet und keine Verzögerung aufweist, was ihn sowohl für manuellen als auch für Roboterhandel ideal macht. Benutzerhandbuch: Einstellungen, Eingaben und Strategie. Der Atom-Analyst ist ein PA-Preisaktionsindikator, der die Stärke und das Momentum des Preises nutzt, um einen besseren Vorteil auf dem Markt zu finden. Ausgestattet mit fortschrittlichen Filtern, die helfen, Rauschen und falsche Signale z
Trend Screener
STE S.S.COMPANY
4.82 (92)
Trendindikator, bahnbrechende, einzigartige Lösung für Trendhandel und -filterung mit allen wichtigen Trendfunktionen in einem Tool! Es handelt sich um einen 100 % nicht neu zu malenden Multi-Timeframe- und Multi-Währungs-Indikator, der für alle Symbole/Instrumente verwendet werden kann: Forex, Rohstoffe, Kryptowährungen, Indizes und Aktien. Trend Screener ist ein effizienter Trendfolgeindikator, der Pfeiltrendsignale mit Punkten im Diagramm liefert. Die Funktionen, die im Trendanalysator-Indika
Gold Channel is a volatility-based indicator, developed with a specific timing algorithm for the XAUUSD pair, which consists of finding possible corrections in the market. This indicator shows two outer lines, an inner line (retracement line) and an arrow sign, where the theory of the channel is to help identify overbought and oversold conditions in the market. The market price will generally fall between the boundaries of the channel. If prices touch or move outside the channel it is a tra
Currency Strength Wizard ist ein sehr leistungsstarker Indikator, der Ihnen eine Komplettlösung für erfolgreichen Handel bietet. Der Indikator berechnet die Stärke dieses oder jenes Forex-Paares anhand der Daten aller Währungen in mehreren Zeitrahmen. Diese Daten werden in Form von benutzerfreundlichen Währungsindizes und Währungsstärkelinien dargestellt, anhand derer Sie die Stärke dieser oder jener Währung erkennen können. Sie müssen lediglich den Indikator an das Diagramm anhängen, mit dem Si
Derzeit 20% Rabatt! Die beste Lösung für jeden Neueinsteiger oder Expert Händler! Dieses Dashboard arbeitet mit 28 Währungspaaren. Es basiert auf 2 unserer Hauptindikatoren (Advanced Currency Strength 28 und Advanced Currency Impulse). Es bietet einen hervorragenden Überblick über den gesamten Forex-Markt. Es zeigt die Werte der Advanced Currency Strength, die Veränderungsrate der Währungen und die Signale für 28 Devisenpaare in allen (9) Zeitrahmen. Stellen Sie sich vor, wie sich Ihr Hande
- Real price is 80$ - 40% Discount ( It is 49$ now ) Contact me for instruction, any questions! Introduction The breakout and retest strategy is traded support and resistance levels. it involves price breaking through a previous level.  The break and retest strategy is designed to help traders do two main things, the first is to avoid false breakouts. Many false breakouts start with a candlestick that breaks out of a level but ends with an immediate candlestick that brings the price back into t
PZ Day Trading
PZ TRADING SLU
3.67 (3)
Dieser Indikator erkennt Preisumkehrungen im Zick-Zack, wobei nur Preisaktionsanalysen und ein Donchian-Kanal verwendet werden. Es wurde speziell für den kurzfristigen Handel entwickelt, ohne dass ein Nachlackieren oder ein Backpainting erforderlich ist. Es ist ein fantastisches Werkzeug für clevere Trader, die darauf abzielen, das Timing ihrer Operationen zu verbessern. [ Installationsanleitung | Update-Anleitung | Fehlerbehebung | FAQ | Alle Produkte ] Erstaunlich einfach zu handeln Es bi
Clear Breakout
Martin Alejandro Bamonte
5 (1)
Der "Breakout Buy-Sell" Indikator ist darauf ausgelegt, potenzielle Kauf- und Verkaufsgelegenheiten basierend auf Preisdurchbrüchen während verschiedener Marktsitzungen (Tokio, London und New York) zu identifizieren und hervorzuheben. Dieser Indikator hilft Tradern, Kauf- und Verkaufszonen sowie Take-Profit (TP) und Stop-Loss (SL) Niveaus klar zu visualisieren. Nutzungsstrategie Der Indikator kann wie folgt verwendet werden: Erste Einstellungen : Wählen Sie die Marktsitzung und passen Sie den GM
DERZEIT 26% RABATT Die beste Lösung für jeden Newbie oder Expert Trader! Dieser Indikator ist ein einzigartiges, qualitativ hochwertiges und erschwingliches Trading-Tool, da wir eine Reihe von proprietären Funktionen und eine neue Formel integriert haben. Mit nur EINEM Chart können Sie die Währungsstärke für 28 Forex-Paare ablesen! Stellen Sie sich vor, wie sich Ihr Handel verbessern wird, weil Sie in der Lage sind, den genauen Auslösungspunkt eines neuen Trends oder einer Scalping-Gelegenh
PRO Renko System ist ein hochpräzises Handelssystem, das speziell für den Handel mit RENKO-Charts entwickelt wurde. Dies ist ein universelles System, das auf verschiedene Handelsinstrumente angewendet werden kann. Das System neutralisiert effektiv so genannte Marktgeräusche, die Ihnen Zugang zu genauen Umkehrsignalen geben. Der Indikator ist sehr einfach zu bedienen und hat nur einen Parameter, der für die Signalerzeugung verantwortlich ist. Sie können das Tool einfach an jedes Handelsinstr
Zunächst einmal ist es wichtig zu betonen, dass dieses Handelstool ein Nicht-Repaint-, Nicht-Redraw- und Nicht-Verzögerungsindikator ist, was es ideal für professionelles Trading macht. Online-Kurs, Benutzerhandbuch und Demo. Der Smart Price Action Concepts Indikator ist ein sehr leistungsstarkes Werkzeug sowohl für neue als auch erfahrene Händler. Er vereint mehr als 20 nützliche Indikatoren in einem und kombiniert fortgeschrittene Handelsideen wie die Analyse des Inner Circle Traders und Stra
DERZEIT 31% RABATT! Die beste Lösung für jeden Newbie oder Expert Trader! Dieser Indikator ist ein einzigartiges, qualitativ hochwertiges und erschwingliches Handelsinstrument, da wir eine Reihe von proprietären Funktionen und eine geheime Formel eingebaut haben. Mit nur EINEM Chart liefert er Alerts für alle 28 Währungspaare. Stellen Sie sich vor, wie sich Ihr Handel verbessern wird, weil Sie in der Lage sind, den genauen Auslösepunkt eines neuen Trends oder einer Scalping-Gelegenheit zu e
IX Power MT4
Daniel Stein
5 (6)
IX Power bringt die unschlagbare Präzision von FX Power endlich auch zu Nicht-Forex-Symbolen. Es bestimmt präzise die Intensität von kurz-, mittel- und langfristigen Trends in Ihren Lieblingsindizes, Aktien, Rohstoffen, ETFs und sogar Kryptowährungen. Sie können alles analysieren, was Ihr Terminal zu bieten hat. Probieren Sie es aus und erleben Sie, wie sich Ihr Timing beim Handel deutlich verbessert . IX Power Hauptmerkmale 100% präzise, nicht nachpinselnde Berechnungsergebnisse - für
Advanced Supply Demand
Bernhard Schweigert
4.9 (314)
Derzeit 33% Rabatt! Die beste Lösung für jeden Anfänger oder erfahrenen Händler! Dieser Indikator ist ein einzigartiges, qualitativ hochwertiges und erschwingliches Trading-Tool, da wir eine Reihe von proprietären Funktionen und eine neue Formel integriert haben. Mit diesem Update werden Sie in der Lage sein, doppelte Zeitrahmenzonen anzuzeigen. Sie können nicht nur einen höheren TF (Zeitrahmen) anzeigen, sondern sowohl den Chart-TF als auch den höheren TF: SHOWING NESTED ZONES. Alle Supply Dema
NAM Order Blocks
NAM TECH GROUP, CORP.
5 (1)
MT4-Erkennungsanzeige für Auftragsblöcke mit mehreren Zeitrahmen. Eigenschaften - Vollständig anpassbar auf dem Diagrammbedienfeld, bietet vollständige Interaktion. - Verstecken und zeigen Sie das Bedienfeld, wo immer Sie möchten. - Erkennen Sie OBs in mehreren Zeiträumen. - Wählen Sie die anzuzeigende OB-Menge aus. - Verschiedene OBs Benutzeroberfläche. - Verschiedene Filter an OBs. - OB-Näherungsalarm. - ADR High- und Low-Leitungen. - Benachrichtigungsdienst (Bildschirmwar
Enigmera
Ivan Stefanov
5 (4)
ENIGMERA: Der Kern des Marktes https://www.enigmera.com Einführung Dieser Indikator und dieses Handelssystem sind ein bemerkenswerter Ansatz für die Finanzmärkte. ENIGMERA nutzt die fraktalen Zyklen zur genauen Berechnung von Unterstützungs- und Widerstandsniveaus. Er zeigt die echte Akkumulationsphase an und gibt Richtung und Ziele vor.  Ein System, das funktioniert, egal ob wir uns in einem Trend oder in einer Korrektur befinden.  Wie funktioniert es? ENIGMERA besteht aus drei Linien: der
PZ Trend Trading
PZ TRADING SLU
4.8 (5)
Trend Trading ist ein Indikator, der so weit wie möglich von den Markttrends profitiert, indem er Pullbacks und Breakouts zeitlich festlegt. Sie findet Handelsmöglichkeiten, indem sie analysiert, was der Preis während etablierter Trends tut. [ Installationsanleitung | Update-Anleitung | Fehlerbehebung | FAQ | Alle Produkte ] Handeln Sie mit Zuversicht und Effizienz an den Finanzmärkten Profitieren Sie von etablierten Trends, ohne ins Wanken zu geraten Profitable Pullbacks, Ausbrüche und vor
TPSpro RFI Levels
Roman Podpora
4.83 (24)
Umkehr der ersten Impulsniveaus (RFI)       ANWEISUNGEN       Russland       -        ENG    Die Empfehlung basiert auf dem Indikator -   TPSpro   TREND PRO -   Version MT5 Die wichtigsten Elemente in der Branche sind entweder in Zonen oder in der Fabrik enthalten, oder sie führen zu einer Lösung bei einem Kauf oder dem Verkauf eines anderen Instruments. Wenn viele Menschen ihre Rechte nicht auf dem Händlerkonto verschlüsseln, werden die Folgen nicht schnell genug sein. Ich habe es damit abgesc
Scalper Vault
Oleg Rodin
5 (29)
Scalper Vault ist ein professionelles Scalping-System, das Ihnen alles bietet, was Sie für erfolgreiches Scalping benötigen. Dieser Indikator ist ein komplettes Handelssystem, das von Forex- und Binäroptionshändlern verwendet werden kann. Der empfohlene Zeitrahmen ist M5. Das System liefert Ihnen genaue Pfeilsignale in Richtung des Trends. Es liefert Ihnen auch Top- und Bottom-Signale und Gann-Marktniveaus. Die Indikatoren bieten alle Arten von Warnungen, einschließlich PUSH-Benachrichtigungen.
M1 Arrow
Oleg Rodin
4.73 (15)
Eine Intraday-Strategie, die auf zwei Grundprinzipien des Marktes basiert. Der Algorithmus basiert auf der Analyse von Volumina und Preiswellen mit zusätzlichen Filtern. Der intelligente Algorithmus des Indikators gibt nur dann ein Signal, wenn sich zwei Marktfaktoren zu einem vereinen. Der Indikator berechnet Wellen eines bestimmten Bereichs auf dem M1-Diagramm unter Verwendung der Daten des höheren Zeitrahmens. Und um die Welle zu bestätigen, verwendet der Indikator eine Volumenanalyse. Dieser
Order Block Hunter
Noha Mohamed Fathy Younes Badr
5 (2)
Order block hunter indicator is the best indicator for  hunt the order blocks that area where there has been a large concentration of limit orders waiting to be executed Order blocks are identified on a chart by observing previous price action and looking for areas where the price experienced significant movement or sudden changes in direction .This indicator does that for you by using very complicated codes and helps you to take the best areas To buy and sell because it make marks at the best a
`All in One Chart Patterns` Chartmuster sind unter Tradern ein kontroverses Thema; einige glauben, dass sie zuverlässige Signale liefern, während andere dies nicht tun. Unser "Chart Patterns All-in-One"-Indikator zeigt verschiedene Chartmuster an, damit Sie diese Theorien selbst testen können. Die Rentabilität dieser Muster spiegelt nicht die Effektivität des Indikators wider, sondern bewertet vielmehr die Muster selbst. Der "Chart Patterns All-in-One"-Indikator ist ein hervorragendes Werkzeug,
Weitere Produkte dieses Autors
Современный индикатор паттернов PPR по торговой стратегии RAIT. Работает по тренду и без него. Имеет настройки таймфрейма для отображения. Можно настроить количество баров для отображения индикатора на графике. Используется несколько паттернов PPR. Индикатор предпочтительно использовать на часовом таймфрейме и выше, но работает и ниже . Паттерны:  PPR, PinPPR, OutPPR. Отображаются одной стрелкой.
Современный индикатор паттерна Ключевой разворот. Имеет настройки таймфрейма. Можно настроить количество баров для отображения индикатора на графике. Индикатор предпочтительно использовать на часовом таймфрейме и выше, но работает и ниже. Подходит для использования с любой стратегией. Условие отображения: какой таймфрейм указали в настройках, галочку во вкладке отображение ставим там же. Для фильтра можно использовать скользящую среднюю.
Осциллятор   Чайкина   ( Chaikin   Oscillator ) — это индикатор импульса, созданный Марком   Чайкиным , и, очевидно, индикатор назван в честь своего создателя. Он измеряет импульс линии распределения и накопления, используя формулу схождения-расхождения скользящих средних (MACD). На основе данных об этом импульсе мы можем получить представление о направленных изменениях в линии распределения и накопления.
The Average Daily Range (ADR) is an indicator that shows how far a currency pair can move in a day. Automatically displays the upper and lower ADR levels. Automatically calculates the percentage and distance of ADR achieved by the currency pair for the day. Notifies when the price reaches the ADR level. Changes the color and thickness of the ADR line when the price reaches it.
Everything is simple. The usual Information indicator. Shows on the chart: Current spread, buy swap, sell swap, time to close the candle, broker time. The indicator can be placed at the top right or at the bottom right of the chart. Most often, the spread is called the difference between the sale and purchase price. Swap is the cost of transferring a position to the next day. 
The Average Daily Range (ADR) is an indicator that shows how far a currency pair can move in a day. Automatically displays the upper and lower ADR levels. Automatically calculates the percentage and distance of ADR achieved by the currency pair for the day. Changes the color and thickness of the ADR line when the price reaches it. The payment is made in 14 days. It is displayed on timeframes from M1 to M30.
По стратегии "Торговый Хаос" ( Билл Уильямс) . Индикатор, окрашивает бары в цвета awesome oscillator, а также,  окрашивает бар в синий цвет, при возникновении *приседающего* бара MFI. Красный бар - бар находится в отрицательной зоне. Зеленый бар - бар находится в положительной зоне. Индикатор является составной частью торговой системы. Не забудьте установить на график  т акие индикаторы, как индикатор Аллигатора, Осциллятор Awesome, индикатор Фракталов.
Auswahl:
Keine Bewertungen
Antwort auf eine Rezension