• Übersicht
  • Bewertungen (5)
  • Diskussion (2)
  • Neue Funktionen

Tillson TMA T3

5

TILLSON MOVING AVERAGE

Auch bekannt als TMA- oder T3-Indikator. Es ist ein gleitender Durchschnitt , der EMA und DEMA in seiner Formel verwendet und mit einer Binomialerweiterung 3. Grades berechnet wird .

   
   ...
   int     handle1;     //Handle of the Tillson TMA T3.EX5 custom indicator
   double  euBuff1[];
   int TMAperiod=12;
   int TMSshift=0;
   double VolumeFactor=0.618;
   
int OnInit()
   {
   ...
   handle1=iCustom(NULL,PERIOD_CURRENT,"Market\\Tillson TMA T3.EX5",0,TMAperiod,0,0,TMSshift,0,0,VolumeFactor);
   ArrayResize(euBuff1,5); //Set a new array size specifying the reserve of 5 elements!
   ArraySetAsSeries(euBuff1,true);
   ...
   }

//Code to use in indicators
int OnCalculate(..........)
   {   
   ...
   CopyBuffer(handle1, 0, 0, 4, euBuff1); //Copy the values of the indicator Tillson TMA T3 to our indicator buffer
   printf (euBuff1[3]);
   ...
   }

//Code to use in Expert Advisors
void OnTick()
   {   
   ...
   CopyBuffer(handle1, 0, 0, 4, euBuff1); //Copy the values of the indicator Tillson TMA T3 to our indicator buffer
   printf (euBuff1[3]);
   ...
   }


void OnDeinit(const int reason)
  {
   ...
  IndicatorRelease(handle1);  //free the handle of the indicator
  }

Vorteile;

1-      fehlerhaften Signale , die in anderen gleitenden Durchschnitten angetroffen werden ( kontinuierliches Zick zag ) wurde so weit wie möglich reduziert.

2-      verhinderte die Verzögerungen , die bei klassischen gleitenden Durchschnitten zu beobachten sind .

3-      Sehr erfolgreich im Trend

Nachteile

1-      Es ist in horizontalen Märkten nicht wirksam.

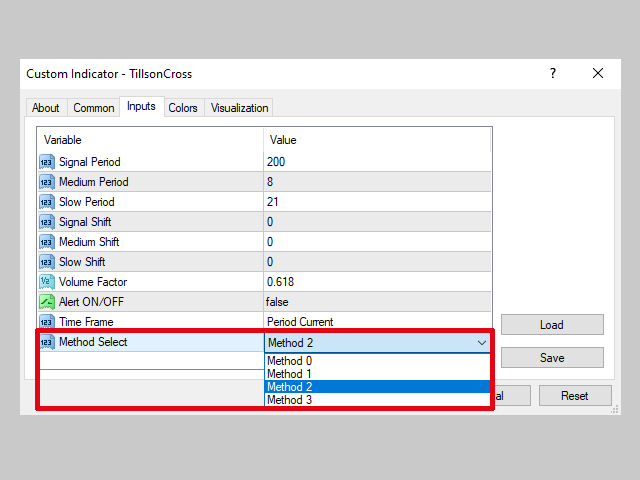
Parameter einstellen;

period; Obwohl der empfohlene Wert 5 ist, können auch Werte von 7 oder 8 verwendet werden.

Volume Factor; Der Bereich von 0 bis 1 ist der empfohlene Wertebereich, kann aber bis maximal 2 gehen. Der empfohlene Wert ist 0,7 . Um die Wirkung von Volume Factor auf T3 einfacher zu erklären: Wenn es Werte nahe 0 annimmt, zeigt es ein ähnliches Verhalten wie EMA, und wenn es Werte nahe 1 annimmt, zeigt es ein ähnliches Verhalten wie DEMA .

BUY/SELL-Signale;

Methode 1; Eine Strategie mit 1 x T3,

Wenn Volume Factor=0,7, Periode=8 und darüber

-          Kreuzen die Balken T3 nach oben, signalisiert BUY

-          SELL-Signal, wenn die Balken auf T3 abfallen

Methode 2; Eine Strategie mit 2 x T3 's,

-          Die kleine Periode T3 unterbricht das Signal der großen Periode T3 vom unteren zum oberen BUY-Signal

-          Die kleine Periode T3 unterbricht die große Periode T3 vom oberen zum unteren SELL-Signal

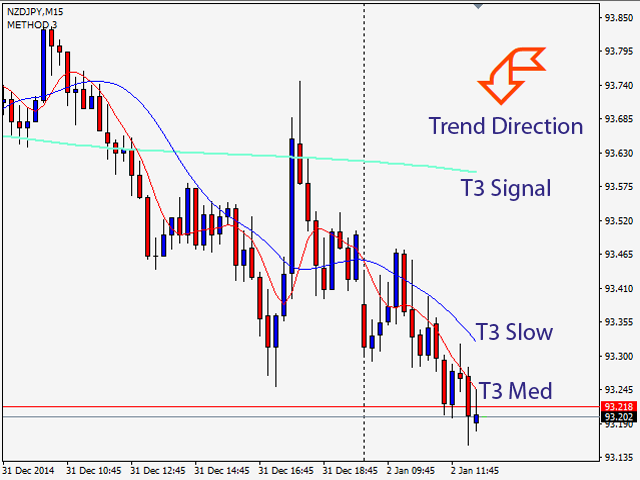
Methode 3; Eine Strategie mit 3 x T3,

Methode 2 um einen dritten richtungsweisenden T3 zu ergänzen . Standardwerte; Periode1=200, Periode2=8, Periode3=21 und Volume Factor=0,7

            T3 mit period1=200 ist die bestimmende Trendrichtung. Mit anderen Worten, wenn T3 in kleinen Perioden über T3 in 200 liegen , wird der Trend als Aufwärtstrend betrachtet und nur BUY- Signale werden gemäß Methode 2 berücksichtigt. Wenn T3 in kleinen Perioden unter T3 in 200 liegen , wird der Trend als Aufwärtstrend betrachtet und nur SELL- Signale werden gemäß Methode 2 berücksichtigt.

Bewertungen 5
Detleff Böhmer
2592
Detleff Böhmer 2023.12.05 09:32 
 

Danke, sehr gute Ergebnisse.

Julpa
182
Julpa 2023.02.24 15:06 
 

Very good signal, I try it for 1 week: nice result

Baki Çetin
50
Baki Çetin 2023.02.23 08:04 
 

Çok teşekkür ederim Emin kardeşim. Çok başarılı olmuş. Ne zamandır bunu arıyordum. Ellerine sağlık.

Empfohlene Produkte
Heikin Ashi MACD
Wojciech Daniel Knoff
5 (2)
Check my version of the moving average convergence divergence (MACD) indicator based on Heikin Ashi calculations. Here you find multi-colored histogram which corresponds to bull (green) / bear(red) trend. Dark and light colors describes weakness/strenght of price trend in time. Also you can switch calculations between normal and Heikin Ashi price type. Note: Buffers numbers for iCustom: 0-MACD, 2-Signal line
FREE
This indicator idea comes from Tushar Chande called Qstick. Technical indicators quantify trend direction and strength in different ways. One way is to use the difference between close and open for each bar and to sum it up over a period of time. The formual is: Qstick (period ) = Average ((close-open ), period ) In this indicator, we can choose how to calculate body by two famous chart types. The first and default indicator settings are based on Heiken Ashi chart, and the second i
FREE
SDivergence
Mobin Zarekar
1 (1)
SDivergence Indicator calculates and shows regular divergences and hidden divergences for MACD and Stochastic(for now). The benefit of this indicator is multiple input variables. Using these inputs you can modify to get more adaptive RD and HD's to your strategy. Guide : 1- First put your desired oscillator (MACD or Stochastic or Both) on the chart. 2- Run SDivergence indicator and set corresponding sub-window index of previously put oscillator in SDivergence input window. -Note: the chart sub-w
FREE
Strong Move
Triet Lam Minh
This indicator combines RSI(14) and ADX(14) to find out the signal that price moves strongly. When it appears signal (represent by the yellow dot), and price is going down, let consider to open a SELL order. Otherwise, let consider to open a BUY order. In this case, the strength of moving is strong (normally after sideway period), so  we can set TP by 3 times of SL  . 
FREE
This is HTF (or MTF) of original Kolier SuperTrend indicator. On this version, you can use 4 Lines of supertrend to define the trend, it will be more powerful. Remade signals on smalls timeframes, the indicator will not repaint if used on small timeframes.
SSACD - Singular Spectrum Average Convergence/Divergence This is an analogue of the MACD indicator based on the Caterpillar-SSA ( Singular Spectrum Analysis ) method. Limited version of the SSACD Forecast indicator. Limitations include the set of parameters and their range. Specificity of the method The Caterpillar-SSA is an effective method to handle non-stationary time series with unknown internal structure. The method allows to find the previously unknown periodicities of the series and mak
FREE
An improved version of the standard Standard Deviation indicator. It is now a responsive and smoothed line. The setup is not straightforward - but I hope you can do it. It is very easy to understand the readings of this indicator, the meaning is the same as that of the usual Standard Deviation. //////////////////////////////////////////////// /////////////////////////////////// I hope this indicator will be very useful to you in successful trading. Good luck.
FREE
MACD divergence indicator finds divergences between price chart and MACD indicator and informs you with alerts (popup, mobile notification or email) . Its main use is to find trend reversals in the chart. Always use the divergence indicators with other technical assets like support resistance zones, candlestick patterns and price action to have a higher possibility to find trend reversals. Three confirmation type for MACD divergences: MACD line cross zero level Price returns to previous H/L Crea
FREE
Chaikin's volatility indicator calculates the spread between the maximum and minimum prices. It judges the value of volatility basing on the amplitude between the maximum and the minimum. Unlike Average True Range , Chaikin's indicator doesn't take gaps into account. According to Chaikin's interpretation, a growth of volume indicator in a relatively short space of time means that the prices approach their minimum (like when the securities are sold in panic), while a decrease of volatility in a l
FREE
MWC Ratio 5
Joerg Hamann
3.5 (6)
The Commitments of Traders Ratio Indicator is one of these things you never thought about it before you really see the magic behind it. The indicator shows the Ratio of long/short positions released by the CFTC once a week. If you have a look on the Sreenshot you can see two (three) zones of interest. Important note: MAs are not available in version 1.0. Zone 1: The Switches (Red -> Green, Green -> Red) Zone 2: MA cross Zone 3: If you combine this with the COX indicator an additional zone will
FREE
The indicator displays a renko chart and a supertrend indicator in real time. After installing the indicator, the window will display the Renko chart and the supertrend indicator in the same window. This allows you to more clearly and visually see the entry and exit points when a trend reversal occurs. The signal to open a position is the intersection of the Renko candlestick of the supertrend indicator point and the appearance of the opposite signal of the supertrend indicator. The indicator
FREE
Laguerre Filter
Fernando Lahude Ritter
5 (1)
Laguerre Indicator with Gamma Input Overview: The Laguerre Indicator is a sophisticated financial analysis tool designed to provide traders and investors with a dynamic and responsive method to track market trends. Its core functionality is centered around a unique algorithm that adapts to market volatility, offering clearer insights compared to traditional indicators. Key Feature - Gamma Input: Gamma: The sole input for the Laguerre Indicator, 'gamma,' plays a pivotal role in calibrating the i
FREE
Original MACD
Kirill Paskhin
5 (3)
Moving Average Convergence/Divergence — схождение/расхождение скользящих средних — технический индикатор, разработанный Джеральдом Аппелем (Gerald Appel), используемый в техническом анализе для проверки силы и направления тренда, а также определения разворотных точек. Встроенный в MetaTrader 5 индикатор MACD не соответствует задумке автора (Gerald Appel): -линия MACD графически изображена в виде гистограммы, однако гистограммой отражается разница между линией MACD и сигнальной линией;  -сигнал
FREE
ZamanCyclesPOC
Mahmoud Sabry Mohamed Youssef
5 (5)
Everyone knows how to analyze the market , which level to buy / sell  this is an easy job , which leads to unusual horrible loses , very little few people knows WHEN then enter the market , time is Money , this is the key!!! This version is a Proof of concept limited version of ZamanCYcles founded here: https://www.mql5.com/en/market/product/81883?source=Site +Market+Product+Page This works Only on 3 Minutes Time frame for 45 Candles Get rest of planets and more than 10 other algorithms to pre
FREE
LT Force
Thiago Duarte
5 (6)
For those who like trend the Force will be a very useful indicator. This is because it is based on the famouse ADX, which measure the strenght of a trend, but without its 3 confusing lines. Force has its very simple interpretation: if the histogram is above zero level the trend is up, otherwise it is down. You can use it to find divergences too, which is very profitable. Thanks to Andre Sens for the version 1.1 idea. If you have any doubt or suggestion, please, contact me. Enjoy! This is a fre
FREE
Simple Long Term MACD
Stephen Carmody
1 (1)
Long Term Double MACD Strategy with EMA Trend Confirmation This strategy uses a leading and lagging MACD indicator. The leading indicator gives the entry signals, and the lagging indicator gives the exit signals. This Expert does not use any account management and as such you should make sure to set good stop losses. Works best on longer timeframes on low volatility pairs.
FREE
Rsi DA
Vitaly Dodonov
5 (2)
Что такое RSI?  Индикатор RSI (Relative Strength Index, индекс относительной силы) — это индикатор, который измеряет соотношение восходящих и нисходящих движений. Расчет ведётся таким образом, что индекс выражается в диапазоне от 0 до 100. Как понять RSI? Если значение RSI находится равно 70 и больше, считается, что инструмент находится в состоянии перекупленности (ситуация, когда цены выросли выше, нежели того ожидал рынок). Значение RSI на уровне 30 и ниже считается сигналом о том, что инст
FREE
Magic Trend
Arnold Kurapa
3.67 (3)
Magic Trend  This MT5 indicator is a Moving Average with 3 signal colors. The 3 input parameters on this Indicator give you a chance to set any Moving Average of choice. A combination of 2 different exponential moving averages, relative strength index, commodity channel index, and William's percent range provide the signals. White color = Null/No/Exit Signal Green color = Buy Signal Red color = Sell Signal Point To Note: Confirm the color change only after the current candle closes to avo
FREE
Driver Road Bands
Kenan Ozkarakas
4 (4)
"Driver Road Bands" indicator that is designed to be used in the 1H, 4H and 1D timeframes in the most ideal way. If we compare timeframes to roads and streets; main streets and highways with high traffic volume are similar to high-time timeframes in technical analysis. If you can interpret the curvilinear and linear lines drawn by this indicator on the graphic screen with your geometric perspective and develop your own buy and sell strategies; you may have the key to being a successful trader.
FREE
OsMA DA
Vitaly Dodonov
Что такое OsMA DA?   Индикатор OsMA DA – это осциллятор, который построен на показаниях другого осциллятора – MACD. OsMA DA показывает расхождение между сигнальной линией MACD и его гистограммой. Момент пересечения гистограммы и линии – это нулевая отметка OsMA.   Если гистограмма MACD поднимается выше линии, то гистограмма самого OsMA DA поднимается выше нулевой отметки. В обратной ситуации OsMA DA демонстрирует отрицательные значения.   OsMA DA более узконаправленный индикатор, чем MACD. OsMA
FREE
IMA Finder MT5
Mubashir Mohamed Quraish Albarakat
1 (1)
This indicator is designed based on the Moving Origin indicator When the moving origin indicator breaks the price, this indicator gives a signal It is useful for better viewing of signals and analysis on them Attributes: Can be used in all symbols Can be used in all time frames Too many signals Simple and quick settings Easy way to work Settings: period: like moving average settings alarmShow: If you want to receive an alert in Metatrader after receiving the signal, enable this setting a
FREE
Curver Arrows
Francis Dube
4 (9)
This indicator is a straight port of a well known MetaTrader 4 indicator that is freely available on the Internet. It does not redraw at all. It implements a type of breakout strategy. The arrows indicate market direction. Use the indicator on M15 charts and higher. The indicator draws two bands near price action and generates signals when the price closes below the lower band and also above the upper band. The indicator uses periodic highs and lows to calculate upper and lower threshold bands.
FREE
Zona de Consolidacao
Edilson Domingos
5 (1)
It makes it easier to see where there have been consolidation zones for previous prices and allows you to highlight the histogram where there is the biggest consolidation zone. Input parameters Intervalo de preço Is the price between the histograms Periodo Number of candle sticks to be analyzed Porcentagem Highlights the histogram where there is minimal consolidation in relation to the analyzed period
FREE
Price Momentum
Flavio Javier Jarabeck
4.92 (13)
Value Chart indicator presents the Price evolution in a new form. This indicator, Price Momentum , was developed taking all the calculations presented in the book " Dynamic Trading Indicators " by Mark W. Helweg and David Stendahl (2002). The technique involves de-trended Prices from a user-defined Period of analysis and the addition of a Volatility index correction. The result is an Oscillator with 3 zones: Fair Price Value, Overbought/Oversold and Extremely Overbought/Oversold zones. Adding th
FREE
Follow The Line MT5
Oliver Gideon Amofa Appiah
4.4 (30)
This indicator obeys the popular maxim that: "THE TREND IS YOUR FRIEND" It paints a GREEN line for BUY and also paints a RED line for SELL. (you can change the colors). It gives alarms and alerts of all kinds. IT DOES NOT REPAINT and can be used for all currency pairs and timeframes. Yes, as easy and simple as that. Even a newbie can use it to make great and reliable trades. NB: For best results, get my other premium indicators for more powerful and reliable signals. Get them here: https://www.m
FREE
A professional tool for trading - the divergence indicator between the  Stochastic and the price, which allows you to receive a signal about a trend reversal in a timely manner or catch price pullback movements (depending on the settings). The indicator settings allow you to adjust the strength of the divergence due to the angle of the  Stochastic peaks and the percentage change in price, which makes it possible to fine-tune the signal strength. The indicator code is optimized and is tested ver
FREE
Super Trend eu
Emin Ulucanli
5 (3)
SUPERTREND; Es ist ein Trendfolgeindikator, der auf dem von Olivier Seban erstellten SuperTrend ATR basiert. Es kann verwendet werden, um Änderungen in der Trendrichtung zu erkennen und Stopps zu lokalisieren. Wenn der Preis unter die Indikatorkurve fällt, wird er rot und zeigt einen Abwärtstrend an. Wenn sich der Preis dagegen über die Kurve bewegt, wird der Indikator grün und zeigt einen Aufwärtstrend an. Wie andere Indikatoren funktioniert es gut auf SuperTrend, wenn es in Verbindung mit ande
FREE
Multi RsI BB MT5
Mansour Babasafary
5 (1)
A combined indicator of two famous indicators: RSI , Bollinger Bands Can be used in all currency pairs Can be used in all time frames with many signals Very simple and fast to use Description: This indicator is made from the combination of RSI and Bollinger Bands indicators As you can see, it shows good signals and is worth using and testing We hope you are satisfied with this indicator Settings: show past show candle: Displays the number of candles that the indicator calculates. For
FREE
A professional tool for trading - the divergence indicator between the  MACD and the price, which allows you to receive a signal about a trend reversal in a timely manner or catch price pullback movements (depending on the settings). The indicator settings allow you to adjust the strength of the divergence due to the angle of the  MACD peaks and the percentage change in price, which makes it possible to fine-tune the signal strength. The indicator code is optimized and is tested very quickly as
FREE
What is MACD? MACD is an acronym for Moving Average Convergence Divergence . This technical indicator is a tool that’s used to identify moving averages that are indicating a new trend, whether it’s bullish or bearish. There is a common misconception when it comes to the lines of the MACD. There are two lines: The " MACD Line " The " Signal Line " The two lines that are drawn are NOT moving averages of the price. The MACD Line is the difference (or distance) between two moving
FREE
Käufer dieses Produkts erwarben auch
Atomic Analyst MT5
Issam Kassas
5 (13)
Zunächst einmal ist es erwähnenswert, dass dieser Handelsindikator nicht neu malt, nicht neu zeichnet und keine Verzögerung aufweist, was ihn sowohl für manuellen als auch für Roboterhandel ideal macht. Benutzerhandbuch: Einstellungen, Eingaben und Strategie. Der Atom-Analyst ist ein PA-Preisaktionsindikator, der die Stärke und das Momentum des Preises nutzt, um einen besseren Vorteil auf dem Markt zu finden. Ausgestattet mit fortschrittlichen Filtern, die helfen, Rauschen und falsche Signale z
Zunächst einmal ist es wichtig zu betonen, dass dieses Handelssystem ein Nicht-Repainting-, Nicht-Redrawing- und Nicht-Verzögerungsindikator ist, was es sowohl für manuelles als auch für automatisches Trading ideal macht. Online-Kurs, Handbuch und Vorlagen herunterladen. Das "Smart Trend Trading System MT5" ist eine umfassende Handelslösung, die für neue und erfahrene Trader maßgeschneidert ist. Es kombiniert über 10 Premium-Indikatoren und bietet mehr als 7 robuste Handelsstrategien, was es zu
Gold Stuff mt5
Vasiliy Strukov
4.89 (173)
Gold Stuff mt5-Ein Trendindikator, der speziell für Gold entwickelt wurde, kann auch auf allen Finanzinstrumenten verwendet werden. Der Indikator wird nicht neu gezeichnet und verzögert sich nicht. Empfohlener Zeitrahmen H1. WICHTIG! Kontaktieren Sie mich sofort nach dem Kauf, um Anweisungen und Bonus zu erhalten! DATEN Draw Arrow - inkl.aus. zeichnen von Pfeilen in einem Diagramm. Alerts-inkl.aus.akustische Warnungen. E - mail notification-inkl.aus. benachrichtigungen per E-Mail. Puch-
Quantum Trend Sniper
Bogdan Ion Puscasu
5 (39)
Wir stellen vor       Quantum Trend Sniper Indicator   , der bahnbrechende MQL5-Indikator, der die Art und Weise, wie Sie Trendumkehrungen erkennen und handeln, verändert! Entwickelt von einem Team erfahrener Händler mit über 13 Jahren Handelserfahrung,       Quantum Trend Sniper-Indikator       wurde entwickelt, um Ihre Trading-Reise mit seiner innovativen Methode zur Identifizierung von Trendumkehrungen mit extrem hoher Genauigkeit auf ein neues Niveau zu heben. ***Kaufe Quantum Trend Snipe
Dragon Multi Indicator MT5
Mansour Babasafary
5 (3)
74% discount for the next 10 buyers (original price $605): 1 left Get a 50% bonus by buying (or even renting) any of our products. After buying (or renting), send a message for more information. 3 Indicators in 1 indicator Strategy based on price action Made specifically for the best forex currency pairs Can be used in the best time frame of the market at a very reasonable price This indicator is basically 3 different indicatos . But we have combined these 3 indicators in 1 indicator so th
Reversal First Impulse levels (RFI)      INSTRUCTIONS        RUS       -       ENG              R ecommended to use with an indicator   -   TREND PRO -  Version MT4                 A key element in trading is zones or levels from which decisions to buy or sell a trading instrument are made. Despite attempts by major players to conceal their presence in the market, they inevitably leave traces. Our task was to learn how to identify these traces and interpret them correctly. Main functions:: Di
Zunächst einmal ist es wichtig zu betonen, dass dieses Handelstool ein Nicht-Repaint-, Nicht-Redraw- und Nicht-Verzögerungsindikator ist, was es ideal für professionelles Trading macht. Online-Kurs, Benutzerhandbuch und Demo. Der Smart Price Action Concepts Indikator ist ein sehr leistungsstarkes Werkzeug sowohl für neue als auch erfahrene Händler. Er vereint mehr als 20 nützliche Indikatoren in einem und kombiniert fortgeschrittene Handelsideen wie die Analyse des Inner Circle Traders und S
FX Volume MT5
Daniel Stein
4.94 (17)
Erhalten Sie Ihr tägliches Marktupdate mit Details und Screenshots über unser Morning Briefing hier auf mql5 und auf Telegram ! FX Volume ist der ERSTE und EINZIGE Volumenindikator, der einen ECHTEN Einblick in die Marktstimmung aus Sicht eines Brokers bietet. Es bietet fantastische Einblicke in die Positionierung von institutionellen Marktteilnehmern, wie z.B. Brokern, auf dem Forex-Markt, viel schneller als COT-Berichte. Diese Informationen direkt auf Ihrem Chart zu sehen, ist der wahre Game
TPSpro TRENDPRO  - is a trend indicator that automatically analyzes the market and provides information about the trend and each of its changes, as well as giving signals for entering trades without redrawing! The indicator uses each candle, analyzing them separately. referring to different impulses - up or down impulse. Exact entry points into transactions for currencies, crypto, metals, stocks, indices!  -  Version MT4               DETAILED DESCRIPTION               R ecommended to use with
RelicusRoad Pro MT5
Relicus LLC
4.82 (22)
Jetzt 147 US -Dollar (nach ein paar Aktualisierungen auf 499 US -Dollar) - Unbegrenzte Konten (PCs oder MACs) RelicusRoad Benutzerhandbuch + Schulungsvideos + Zugang zur privaten Discord-Gruppe + VIP-Status EINE NEUE ART, DEN MARKT ZU BETRACHTEN RelicusRoad ist der weltweit leistungsstärkste Handelsindikator für Forex, Futures, Kryptowährungen, Aktien und Indizes und gibt Händlern alle Informationen und Tools, die sie benötigen, um profitabel zu bleiben. Wir bieten technische Analysen un
Trend Screener Pro MT5
STE S.S.COMPANY
4.87 (62)
Nutzen Sie die Macht des Trendhandels mit Trend Screener Indicator: Ihrer ultimativen Trendhandelslösung, die auf Fuzzy-Logik und einem System mit mehreren Währungen basiert! Steigern Sie Ihren Trendhandel mit Trend Screener, dem revolutionären Trendindikator mit Fuzzy-Logik. Es handelt sich um einen leistungsstarken Trendfolgeindikator, der über 13 Premium-Tools und -Funktionen sowie 3 Handelsstrategien kombiniert und ihn zu einer vielseitigen Wahl macht, um Ihren Metatrader in einen Trendanaly
Bill Williams Advanced
Siarhei Vashchylka
5 (4)
Bill Williams Advanced is designed for automatic chart analysis using Bill Williams' "Profitunity" system. The indicator analyzes four timeframes at once. Manual (Be sure to read before purchasing) Advantages 1. Automatically analyzes the chart using the "Profitunity" system of Bill Williams. The found signals are placed in a table in the corner of the screen. 2. Equipped with a trend filter based on the Alligator indicator. Most of the system signals are recommended to be used only accordi
ICT, SMC, SMART MONEY CONCEPTS, SMART MONEY, Smart Money Concept, Support and Resistance, Trend Analysis, Price Action, Market Structure, Order Blocks, BOS/CHoCH,   Breaker Blocks ,  Momentum Shift,   Supply&Demand Zone/Order Blocks , Strong Imbalance,   HH/LL/HL/LH,    Fair Value Gap, FVG,  Premium  &   Discount   Zones, Fibonacci Retracement, OTE, Buy Side Liquidity, Sell Side Liquidity, BSL/SSL Taken, Equal Highs & Lows, MTF Dashboard, Multiple Time Frame, BigBar, HTF OB, HTF Market Structure
AW Trend Predictor MT5
AW Trading Software Limited
4.77 (56)
Die Kombination von Trend- und Aufschlüsselungsebenen in einem System. Ein fortschrittlicher Indikatoralgorithmus filtert Marktrauschen, bestimmt den Trend, Einstiegspunkte sowie mögliche Ausstiegsniveaus. Indikatorsignale werden in einem Statistikmodul aufgezeichnet, das es Ihnen ermöglicht, die am besten geeigneten Tools auszuwählen, die die Wirksamkeit der Signalhistorie zeigen. Der Indikator berechnet Take-Profit- und Stop-Loss-Marken. Handbuch und Anleitung ->   HIER   / MT4-Version ->   H
Quantum Heiken Ashi PRO MT5
Bogdan Ion Puscasu
4.5 (8)
Wir stellen den   Quantum Heiken Ashi PRO   vor Die Heiken-Ashi-Kerzen wurden entwickelt, um klare Einblicke in Markttrends zu geben und sind bekannt für ihre Fähigkeit, Rauschen herauszufiltern und falsche Signale zu eliminieren. Verabschieden Sie sich von verwirrenden Preisschwankungen und begrüßen Sie eine glattere, zuverlässigere Diagrammdarstellung. Was den Quantum Heiken Ashi PRO wirklich einzigartig macht, ist seine innovative Formel, die traditionelle Candlestick-Daten in leicht lesbare
Wir stellen vor       Quantum Breakout PRO   , der bahnbrechende MQL5-Indikator, der die Art und Weise, wie Sie mit Breakout-Zonen handeln, verändert! Entwickelt von einem Team erfahrener Händler mit über 13 Jahren Handelserfahrung,       Quantum Breakout PRO       ist darauf ausgelegt, Ihre Handelsreise mit seiner innovativen und dynamischen Breakout-Zone-Strategie auf ein neues Niveau zu heben. Der Quantum Breakout Indicator zeigt Ihnen Signalpfeile auf Breakout-Zonen mit 5 Gewinnzielzone
Blahtech Supply Demand MT5
Blahtech Limited
4.57 (14)
Was: $299  Now: $99   Supply Demand uses previous price action to identify potential imbalances between buyers and sellers. The key is to identify the better odds zones, not just the untouched ones. Blahtech Supply Demand indicator delivers functionality previously unavailable on any trading platform. This 4-in-1 indicator not only highlights the higher probability zones using a multi-criteria strength engine, but also combines it with multi-timeframe trend analysis, previously confirmed swings
FxaccurateLS
Shiv Raj Kumawat
WHY IS OUR FXACCCURATE LS MT5 THE PROFITABLE ? PROTECT YOUR CAPITAL WITH RISK MANAGEMENT Gives entry, stop and target levels from time to time. It finds Trading opportunities by analyzing what the price is doing during established trends. POWERFUL INDICATOR FOR A RELIABLE STRATEGIES We have made these indicators with a lot of years of hard work. It is made at a very advanced level. Established trends provide dozens of trading opportunities, but most trend indicators completely ignore them!
Gartley Hunter Multi
Siarhei Vashchylka
5 (6)
Gartley Hunter Multi - An indicator for searching for harmonic patterns simultaneously on dozens of trading instruments and on all classic timeframes: (m1, m5, m15, m30, H1, H4, D1, Wk, Mn). Manual (Be sure to read before purchasing) | Version for MT4 Advantages 1. Patterns: Gartley, Butterfly, Shark, Crab. Bat, Alternate Bat, Deep Crab, Cypher 2. Simultaneous search for patterns on dozens of trading instruments and on all classic timeframes 3. Search for patterns of all possible sizes. Fr
Der ADR-Umkehrindikator zeigt Ihnen auf einen Blick, wo der Preis derzeit im Verhältnis zu seiner normalen durchschnittlichen Tagesspanne gehandelt wird. Sie erhalten sofortige Benachrichtigungen per Pop-up, E-Mail oder Push, wenn der Preis seine durchschnittliche Spanne und darüber liegende Niveaus Ihrer Wahl überschreitet, sodass Sie schnell in Pullbacks und Umkehrungen einsteigen können. Der Indikator zeichnet horizontale Linien auf dem Chart an den durchschnittlichen täglichen Range-Extreme
FX Power MT5 NG
Daniel Stein
5 (5)
Erhalten Sie Ihr tägliches Marktupdate mit Details und Screenshots über unser Morning Briefing hier auf mql5 und auf Telegram ! FX Power MT5 NG ist die nächste Generation unseres langjährig sehr beliebten Währungsstärkemessers FX Power. Und was bietet dieser Stärkezähler der nächsten Generation? Alles, was Sie am ursprünglichen FX Power geliebt haben PLUS GOLD/XAU-Stärkeanalyse Noch präzisere Berechnungsergebnisse Individuell konfigurierbare Analysezeiträume Anpassbares Berechnungslimit für noc
Black Dragon indicator mt5
Ramil Minniakhmetov
4.82 (57)
Der Trenderkennungsindikator ergänzt jede Strategie und kann auch als unabhängiges Werkzeug verwendet werden. Vorteile Einfach zu bedienen, überfrachtet das Diagramm nicht mit unnötigen Informationen; Kann als Filter für jede Strategie verwendet werden; Verfügt über eingebaute dynamische Unterstützungs- und Widerstandsebenen, die sowohl zur Gewinnmitnahme als auch zum Setzen von Stop-Loss verwendet werden können; Der Indikator ändert seine Farbe nicht, nachdem die Kerze geschlossen wurde;
Was: $249  Now: $99   Market Profile defines a number of day types that can help the trader to determine market behaviour. A key feature is the Value Area, representing the range of price action where 70% of trading took place. Understanding the Value Area can give traders valuable insight into market direction and establish the higher odds trade. It is an excellent addition to any system you may be using. Inspired by Jim Dalton’s book “Mind Over Markets”, this indicator is designed to suit the
Zeichnen Sie automatisch Unterstützungs- und Widerstandsniveaus PLUS Antriebskerzenlücken auf Ihrem Chart ein, so dass Sie sehen können, wohin sich der Preis wahrscheinlich als Nächstes bewegen und/oder möglicherweise umkehren wird. Dieser Indikator wurde entwickelt, um als Teil der Positionshandelsmethodik verwendet zu werden, die auf meiner Website (The Market Structure Trader) gelehrt wird, und zeigt Schlüsselinformationen für die Zielsetzung und potenzielle Einstiege an. MT4 Version:  htt
Advanced Supply Demand MT5
Bernhard Schweigert
4.53 (15)
Derzeit 33% Rabatt! Die beste Lösung für jeden Anfänger oder erfahrenen Händler! Dieser Indikator ist ein einzigartiges, qualitativ hochwertiges und erschwingliches Trading-Tool, da wir eine Reihe von proprietären Funktionen und eine neue Formel integriert haben. Mit diesem Update werden Sie in der Lage sein, doppelte Zeitrahmenzonen anzuzeigen. Sie können nicht nur einen höheren TF (Zeitrahmen) anzeigen, sondern sowohl den Chart-TF als auch den höheren TF: SHOWING NESTED ZONES. Alle Supply Dema
Die beste Lösung für jeden Newbie oder Expert Trader! Dieser Indikator ist ein einzigartiges, qualitativ hochwertiges und erschwingliches Trading-Tool, da wir eine Reihe von proprietären Funktionen und eine neue Formel integriert haben. Mit nur EINEM Chart können Sie die Währungsstärke für 28 Forex-Paare ablesen! Stellen Sie sich vor, wie sich Ihr Handel verbessern wird, weil Sie in der Lage sind, den genauen Auslösungspunkt eines neuen Trends oder einer Scalping-Gelegenheit zu erkennen. Be
IX Power MT5
Daniel Stein
5 (3)
IX Power   bringt die unschlagbare Präzision von FX Power endlich auch zu Nicht-Forex-Symbolen. Es bestimmt präzise die Intensität von kurz-, mittel- und langfristigen Trends in Ihren Lieblingsindizes, Aktien, Rohstoffen, ETFs und sogar Kryptowährungen. Sie können   alles analysieren, was   Ihr Terminal zu bieten hat. Probieren Sie es aus und erleben Sie, wie   sich Ihr Timing   beim Handel   deutlich verbessert . IX Power Hauptmerkmale 100% präzise, nicht nachpinselnde Berechnungsergebni
Fractal Advanced MT5
Siarhei Vashchylka
5 (3)
Fractal Advanced - displays Fractal and Alligator indicators on the price chart. Has wide options for settings and customization. It is also equipped with alerts and a hotkey system. Manual (Be sure to read before purchasing) | Version for MT4 Advantages 1. The indicator does not fill the entire chart with fractals, but allows you to display only relevant signals. 2. The number of fractals is adjusted by scrolling the mouse while holding down the Shift key. 3. Instantly show/hide the Alligator
Dies ist ein Indikator für MT5, der genaue Signale für den Einstieg in einen Handel ohne Repainting (Neuzeichnen) liefert. Er kann auf alle Finanzwerte angewendet werden: Forex, Kryptowährungen, Metalle, Aktien, Indizes. Er liefert ziemlich genaue Schätzungen und sagt Ihnen, wann es am besten ist, eine Position zu eröffnen und zu schließen. Sehen Sie sich das Video (6:22) mit einem Beispiel für die Verarbeitung nur eines Signals an, das sich für den Indikator gelohnt hat! Die meisten Händler ver
The Price Action Finder Multi indicator is an indicator of entry points that searches for and displays Price Action system patterns on dozens of trading instruments and on all standard time frames: (m1, m5, m15, m30, H1, H4, D1, Wk, Mn). The indicator places the found patterns in a table at the bottom of the screen. By clicking on the pattern names in the table, you can move to the chart where this pattern is located. Manual (Be sure to read before purchasing) | Version for MT4 Advantages 1. Pa
Weitere Produkte dieses Autors
Super Trend eu
Emin Ulucanli
5 (3)
SUPERTREND; Es ist ein Trendfolgeindikator, der auf dem von Olivier Seban erstellten SuperTrend ATR basiert. Es kann verwendet werden, um Änderungen in der Trendrichtung zu erkennen und Stopps zu lokalisieren. Wenn der Preis unter die Indikatorkurve fällt, wird er rot und zeigt einen Abwärtstrend an. Wenn sich der Preis dagegen über die Kurve bewegt, wird der Indikator grün und zeigt einen Aufwärtstrend an. Wie andere Indikatoren funktioniert es gut auf SuperTrend, wenn es in Verbindung mit ande
FREE
Pivot Classic, Woodie, Camarilla, Fibonacci and Demark Floor/Classic Pivot-Punkte oder einfach Pivots sind nützlich, um potenzielle Unterstützungs-/Widerstandsniveaus, Handelsspannen, Trendumkehrungen und die Marktstimmung zu identifizieren, indem sie die Höchst-, Tiefst- und Schlusswerte eines Vermögenswerts untersuchen. Die Floor/Classic Pivot Points können wie folgt berechnet werden. Pivot Point (P) = (High + Low + Close)/3 S1 = P * 2 - High S2 = P - (High - Low) S3 = Low – 2*(High - P) R1 =
FREE
DONCHIAN CHANNEL DC Es ist ein von “ Richard Donchian” entwickelter Trendindikator, der aus 3 Schichten besteht, dem oberen Kanal, dem unteren Kanal und dem mittleren Kanal. Es wird auf dem Donchian- Kanal erstellt, indem die höchsten und niedrigsten Preise, die in der vergangenen Periode erreicht wurden, auf dem Preisdiagramm aufgetragen werden. Es wird auch verwendet, um die Volatilität des Marktes zu messen, da es sich um einen expandierenden/kontrahierenden Kanal entsprechend der Zunahme/Abn
FREE
Pivot Classic, Woodie, Camarilla, Fibonacci and Demark Floor/Classic Pivot-Punkte oder einfach Pivots sind nützlich, um potenzielle Unterstützungs-/Widerstandsniveaus, Handelsspannen, Trendumkehrungen und die Marktstimmung zu identifizieren, indem sie die Höchst-, Tiefst- und Schlusswerte eines Vermögenswerts untersuchen. Die Floor/Classic Pivot Points können wie folgt berechnet werden. Pivot Point (P) = (High + Low + Close)/3 S1 = P * 2 - High S2 = P - (High - Low) S3 = Low – 2*(High - P) R1
FREE
DONCHIAN CHANNEL DC Es ist ein von “ Richard Donchian” entwickelter Trendindikator, der aus 3 Schichten besteht, dem oberen Kanal, dem unteren Kanal und dem mittleren Kanal. Es wird auf dem Donchian- Kanal erstellt, indem die höchsten und niedrigsten Preise, die in der vergangenen Periode erreicht wurden, auf dem Preisdiagramm aufgetragen werden. Es wird auch verwendet, um die Volatilität des Marktes zu messen, da es sich um einen expandierenden/kontrahierenden Kanal entsprechend der Zunahme/Abn
FREE
TILLSON MOVING AVERAGE Auch bekannt als TMA- oder T3-Indikator. Es ist ein gleitender Durchschnitt , der EMA und DEMA in seiner Formel verwendet und mit einer Binomialerweiterung 3. Grades berechnet wird . Vorteile; 1-       fehlerhaften Signale , die in anderen gleitenden Durchschnitten angetroffen werden ( kontinuierliches Zick zag ) wurde so weit wie möglich reduziert. 2-       verhinderte die Verzögerungen , die bei klassischen gleitenden Durchschnitten zu beobachten sind . 3-       Sehr erf
FREE
Auswahl:
Detleff Böhmer
2592
Detleff Böhmer 2023.12.05 09:32 
 

Danke, sehr gute Ergebnisse.

Julpa
182
Julpa 2023.02.24 15:06 
 

Very good signal, I try it for 1 week: nice result

Baki Çetin
50
Baki Çetin 2023.02.23 08:04 
 

Çok teşekkür ederim Emin kardeşim. Çok başarılı olmuş. Ne zamandır bunu arıyordum. Ellerine sağlık.

Kong Huang
429
Kong Huang 2023.02.07 11:49 
 

NICE

Findolin
955
Findolin 2023.02.06 19:14 
 

Very good, but unfortunately the colors cannot be changed. They always jump back again.

Antwort auf eine Rezension
Version 1.10 2023.03.07
Ein paar kleinere Änderungen