OutsideBar and InsideBar
- Indikatoren
- Alexander Josef Zeidler
- Version: 1.0
- Aktivierungen: 5
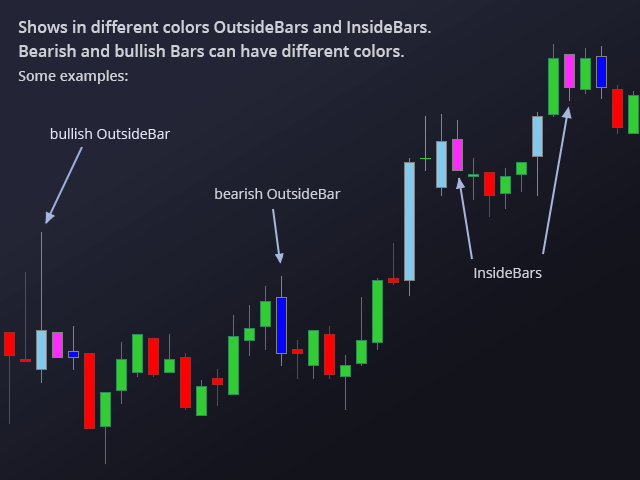
Dieser Indikator zeigt OutsideBars (OB) und InsideBars(IB) im Chart in Kerzenform.
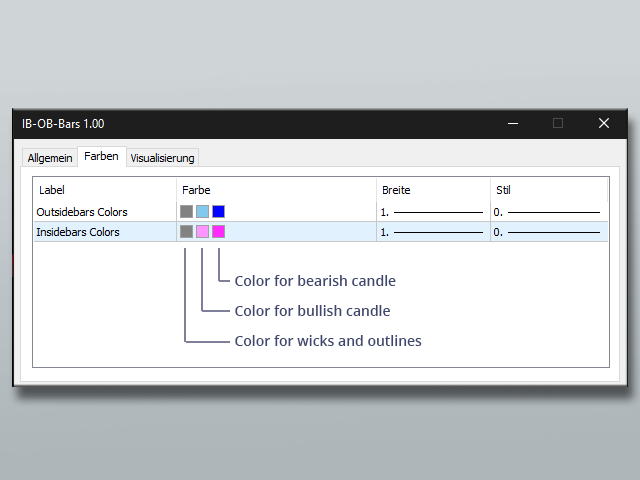
Die Farben der Kerzen können individuell eingestellt werden. Auch unterschiedliche Farben für bärische und bullische IBs oder OBs sind möglich.
Zusätzlich ist auch die Farbe der Dochte bzw. Umrandung einstellbar.