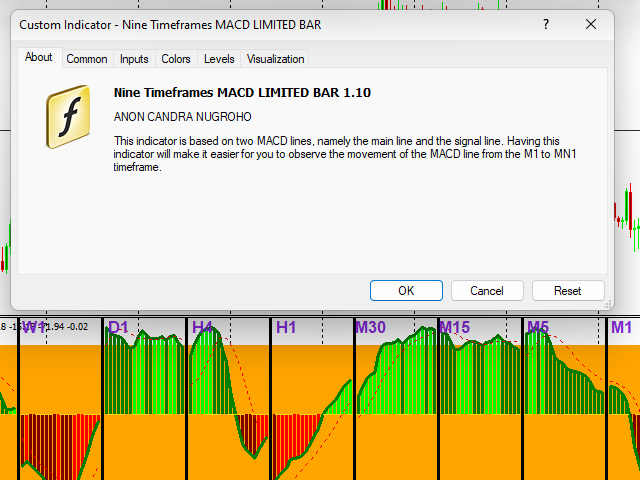
Nine Timeframes MACD Limited Bar
- Indikatoren
- Anon Candra N
- Version: 1.10
- Aktualisiert: 17 Dezember 2022
- Aktivierungen: 15
Analyzing multiple time frames of a currency pair in one window can make you confused.
To analyze multiple time frames, you need reliable indicators.
One of them is using 9TF MACD Limited Bar.
I've been working day and night to create code that is simple but reliable and covers all nine time frames in just one indicator.
Attention! When first installed, the indicator does not look intact. Changing the timeframe will solve the problem.
Let's look at some of the advantages of this indicator:
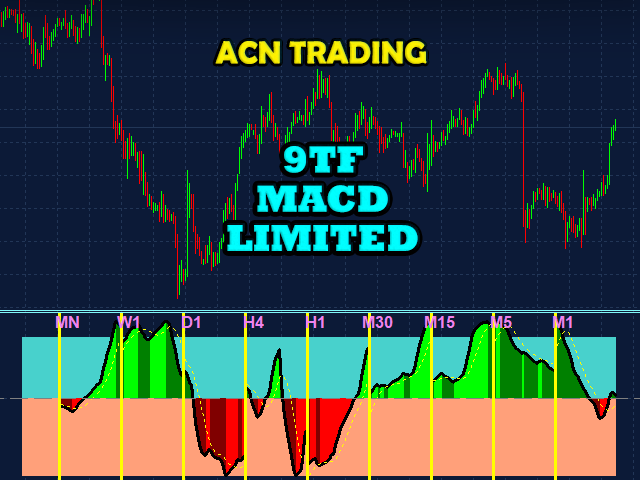
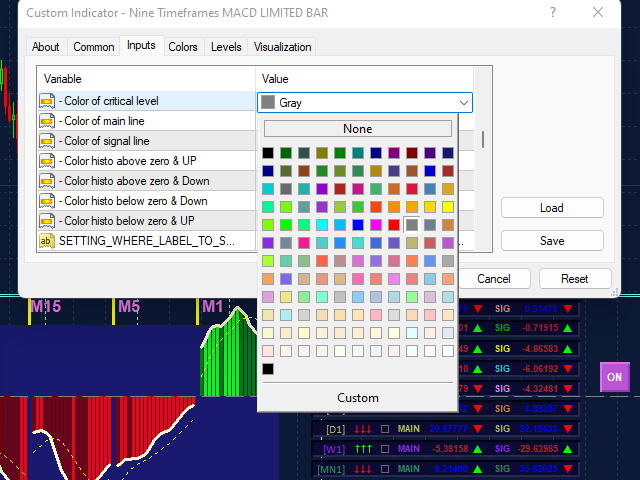
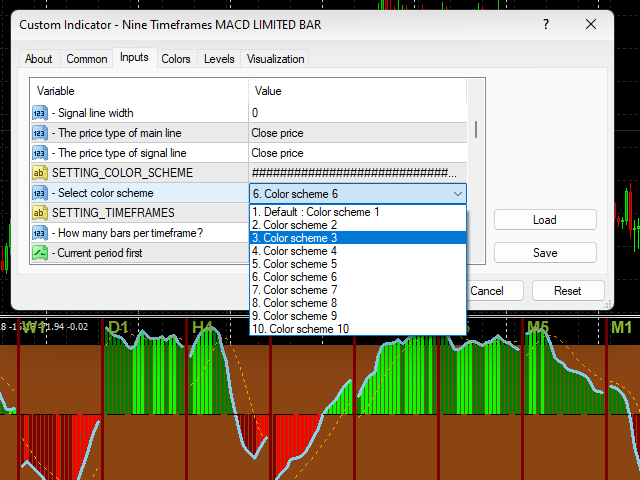
- Colorful histogram.
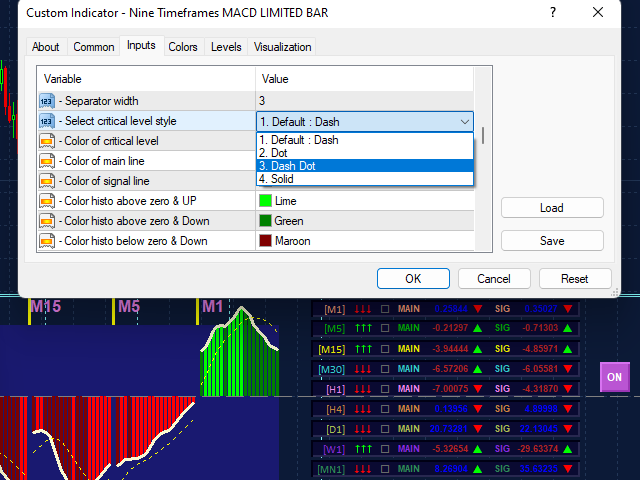
- Critical level line.
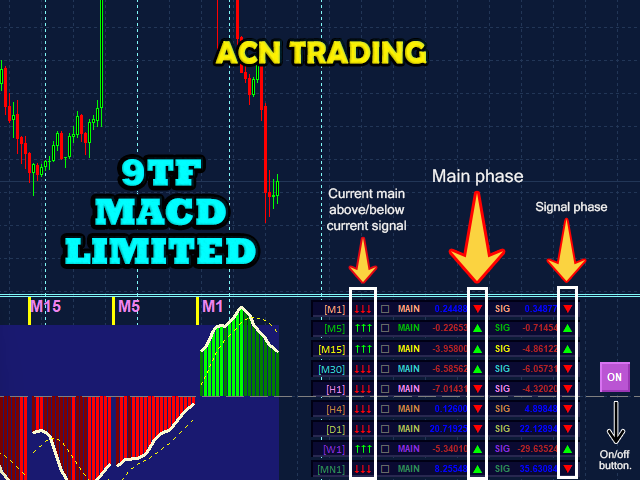
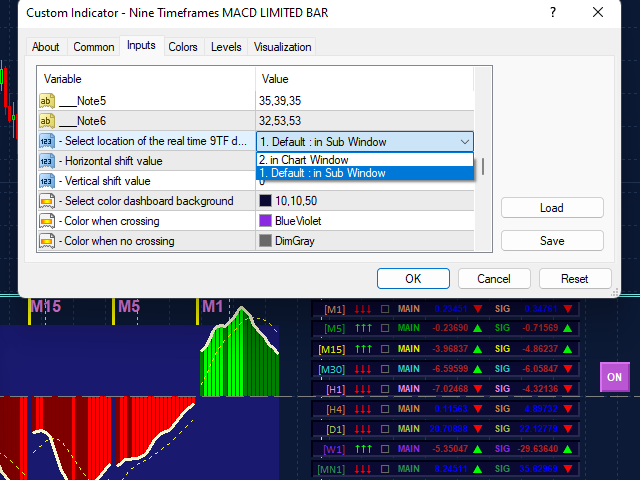
- Real time 9TF dashboard monitor.
- The 9TF dashboard monitor calculations are very accurate even if you change from one time frame to another.
- Monitoring which curve is above the critical level and which is below the critical level.
- Monitoring the curve whether the main MACD is above the signal MACD or vice versa.
- Monitoring the curve whether there is a crossing between the main MACD and the signal MACD.
- Monitoring the movement of the current signal with the previous signal. On the rise or on the way down. (Note: This is very important feature for scalping!)
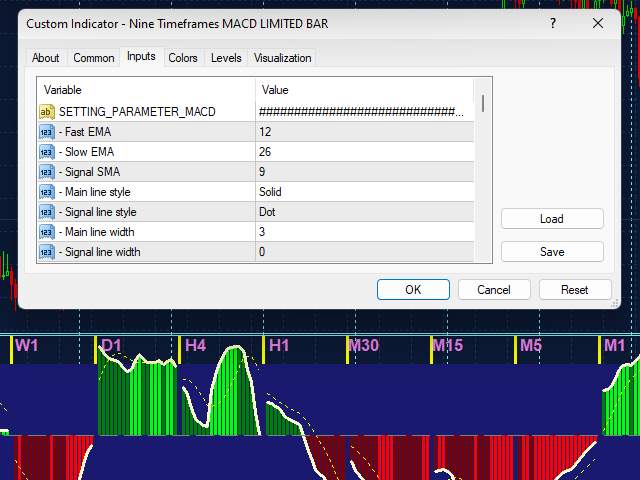
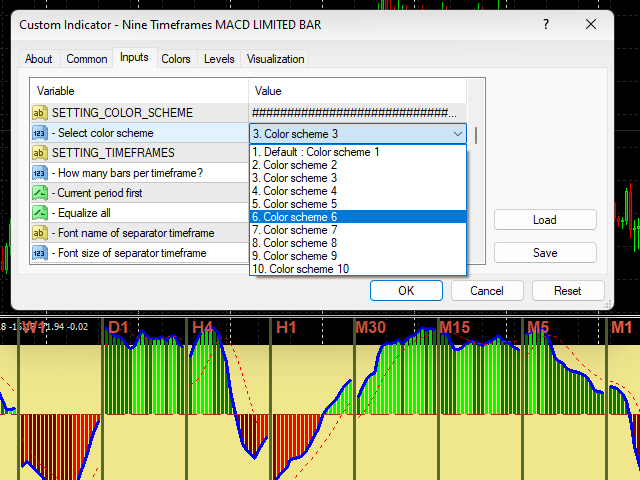
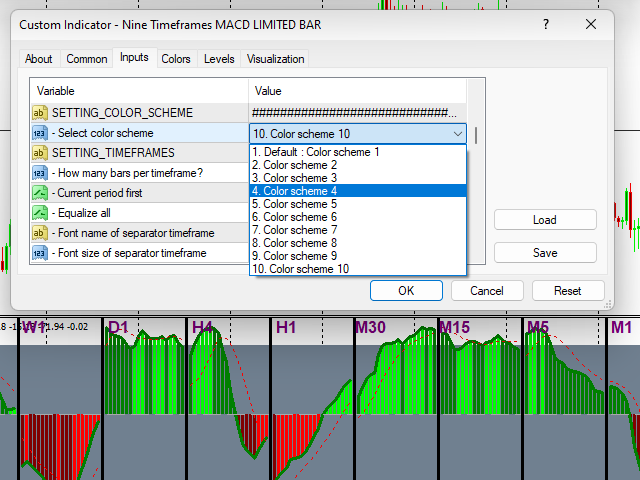
- Ability to change the color.
- Ability to place the 9TF dashboard monitor in your desired location.
- Ability to show or hide the indicator in just one click button.
- Ability to monitor the price action movement from the higher time frame to small time frame.
- Ability to adjust the number of bars to display.
- Can be use to analyze forex, indices, metal/energy, stocks and cryptocurrency.
You can watch the full feature on my YouTube channel. Nothing to hide.
My intention to make this indicator is to increase your winning and profits.
Make confident entries with the best MACD trading indicator.
Get now and trade like a pro.
Thank you.