Diamond by MMD MT5
- Indikatoren
- Mariusz Maciej Drozdowski
- Version: 7.33
- Aktualisiert: 26 April 2023
- Aktivierungen: 5
Diamant von MMD
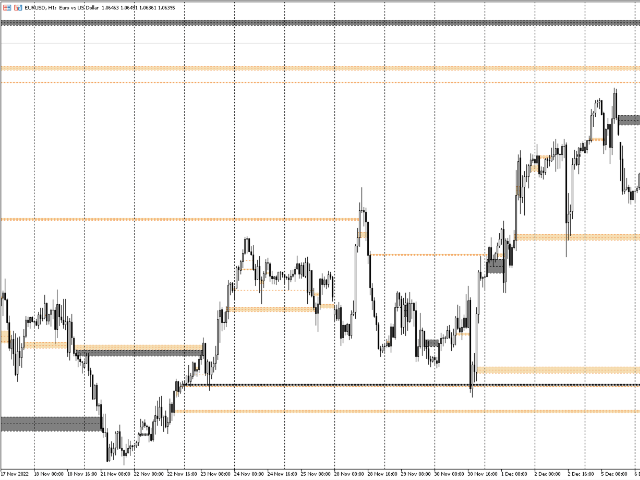
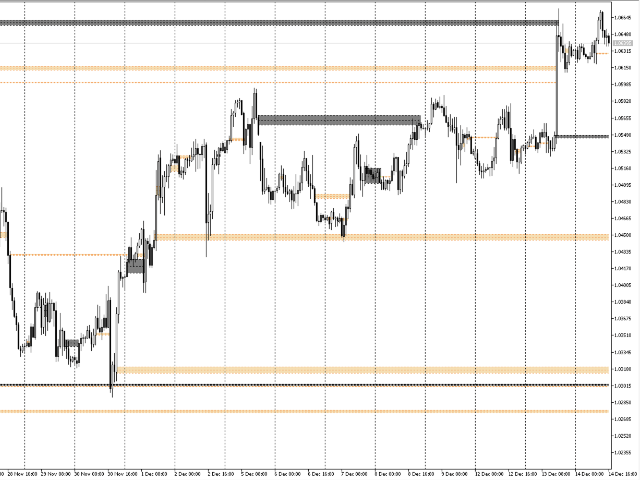
Diamond by MMD ist ein fortschrittlicher Indikator, der Orte identifiziert, die für das Preisverhalten wichtig sind.
Dieser Indikator – in jedem Zeitrahmen – erkennt und markiert Preisreaktionszonen auf dem Chart.
Diamanten – eines der Elemente der Wissenspyramide in der MMD-Methodik – sind Kerzen, die sehr strenge Bedingungen erfüllen.
Es gibt zwei Hauptarten von Diamanten:
- Standarddiamant
- umgekehrte Demenz.
Beide Modelle werden automatisch identifiziert und auf der Karte markiert.
Der Indikator kann Rauten markieren, z.B. vom M5-Intervall auf das H1-Intervall. Die Standardeinstellung des Indikators zeigt Rauten in dem Zeitrahmen an, in dem Sie Ihr Diagramm derzeit geöffnet haben.
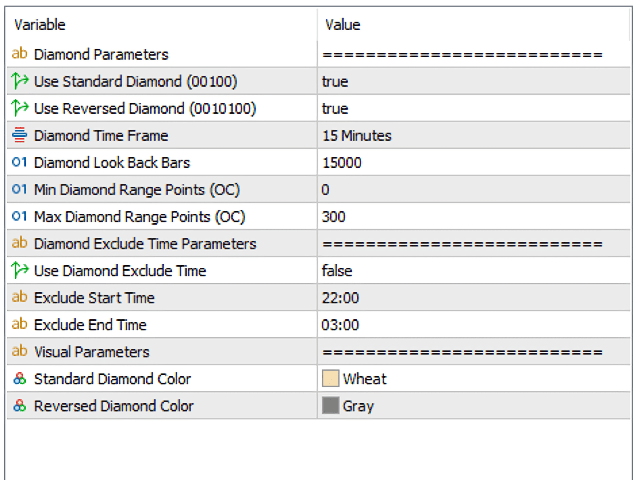
Beschreibung der Indikatorparameter.
Use Standard Diamond - zeigt/verbirgt Diamanten in Modell 00100
Reversed Diamond verwenden – zeigt/verbirgt Diamanten in Modell 0010100
Diamond Time Frame - eine Option, mit der Sie das Intervall angeben können, ab dem Diamanten angezeigt werden sollen. Es ist beispielsweise möglich, Diamanten aus dem M5-Intervall auf dem Chart mit M1- oder H1-Kerzen anzuzeigen.
Diamond Look Back Bars - Angabe der Anzahl der Kerzen - in einem bestimmten Intervall - die gescannt werden - auf der Suche nach Kerzen, die die für Diamanten ausgewählten Parameter erfüllen.
Min Diamond Range Points - minimale Diamantgröße (in Punkten).
Max Diamond Range Points - maximale Diamantgröße (in Punkten).
Use Diamond Exclude Time - Aktivierung/Deaktivierung des Parameters. Dieser Parameter bestimmt den Zeitpunkt, zu dem Kerzen, die die für Diamanten festgelegten Bedingungen erfüllen, nicht auf dem Chart markiert werden. Dies gilt insbesondere für die Nachtstunden.
Startzeit ausschließen – Angabe des Beginns des Zeitraums, in dem Diamanten nicht markiert werden.
Endzeit ausschließen – Angabe des Endes des Zeitraums, in dem Diamanten nicht markiert werden.
Standard Diamond Color - die Farbe des Standarddiamanten.
Farbe des umgekehrten Diamanten – die Farbe des umgekehrten Diamanten.