Simple ATR modern
- Indikatoren
- Pavel Bereznichenko
- Version: 1.2
- Aktualisiert: 26 August 2023
- Aktivierungen: 10
Ein schlankes Werkzeug zur Verfolgung der Marktvolatilität mit größerer Klarheit, ideal sowohl für Daytrading als auch für Swingtrading.
Es ist der beste Indikator für den Handelsstart oder für Anfänger.
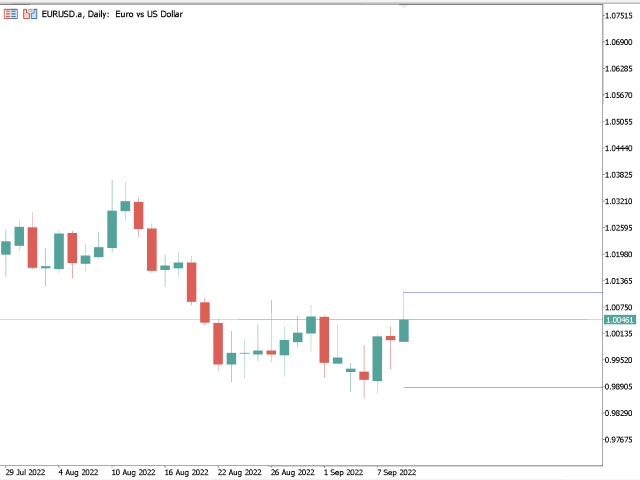
Visuelle Indikatorfarbe: ATR Daily - Blau
Verbessern Sie Ihre Analyse, indem Sie den Indikator mit Volatility Vision kombinieren.
Misst präzise Schwankungen der Marktbedingungen und ist unerlässlich für Entscheidungen im Daytrading und Swingtrading.
Verwendet einen einfachen gleitenden Durchschnitt von 14 Tagen (konfigurierbar) der echten Bereichsindikatoren, um Genauigkeit zu gewährleisten.
Ideal für die Implementierung von Ein- oder Ausstiegsstrategien in Handelssystemen.
Warum ATR-Indikatoren besser sind als andere:
Einfache Anwendung: ATR-Indikatoren sind einfach einzurichten und zu verstehen, auch für Anfänger.
Vielseitigkeit: Geeignet für Daytrading und Swingtrading und bietet Flexibilität in verschiedenen Handelsstrategien.
Zuverlässigkeit: ATR liefert genaue Daten zur Marktvolatilität und hilft Händlern, fundiertere Entscheidungen zu treffen.
Anpassungsfähigkeit: Die Möglichkeit, den gleitenden Durchschnittszeitraum anzupassen, ermöglicht es Händlern, den Indikator an ihre spezifischen Bedürfnisse und Vorlieben anzupassen.
Kombinierbarkeit: ATR lässt sich leicht mit anderen Indikatoren wie Volatility Vision kombinieren, um eine tiefere Analyse der Marktbedingungen zu ermöglichen.