Dot scalp
- Indikatoren
- Andrey Kozak
- Version: 2.0
- Aktualisiert: 21 November 2023
- Aktivierungen: 20
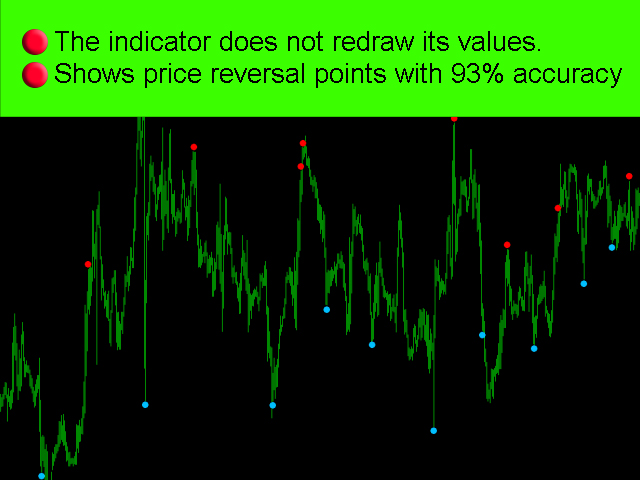
Dot Scalp - zeigt Preisumkehrpunkte mit 93 % Genauigkeit an. Punkte werden nicht neu gezeichnet. Funktioniert gut bei Seitwärtsbewegungen, wenn der Markt flach ist. Der Indikator zeichnet die Punkte der Preisumkehr oder Pullbacks auf dem Chart.
Wie verwendet man diesen Indikator im Handel?
Fügen Sie dem Diagramm den Dot Scalp-Indikator hinzu. Laden Sie auch im Internet einen beliebigen Kanalindikator herunter, der den Kanal auf dem Diagramm anzeigt. Warten Sie auf die Seitwärtsbewegung des Preises, dann zeichnet der Kanalindikator einen Kanal in horizontaler Richtung. Warten Sie danach auf ein Signal von der Dot-Kopfhautanzeige. Wenn der Dot-Scalp-Indikator einen roten Punkt auf dem Chart zeichnet, eröffnen wir einen Verkaufshandel. Wenn der Dot-Scalp-Indikator einen blauen Punkt auf dem Chart zeichnet, eröffnen wir einen Kauf-Trade. TakeProfit-Set 15-35 Punkte. StopLoss stellte 35-65 Punkte ein. Die Größe des Loses wird unabhängig bestimmt. Wir empfehlen, das Los auf nicht mehr als 10 % des Restbetrags festzulegen.
Handelsempfehlungen:
- Währungspaar: gbpusd, eurusd, xauusd, usdchf, usdjpy, eurgbp, audusd, usdcsd, audcad, eurjpy, gbpchf, audjpy, nzdjpy
- Zeitrahmen: m5, m15, m30, H1, H4
- anfängliches Handelsguthaben ab 200 $
- Hebelwirkung >1:50
Anzeigeeinstellungen:
- period - Indikatorzeitraum.
- Dist - Abstand vom Candlestick zum Pfeil.
- bars - die Anzahl der Balken, auf denen der Indikator angezeigt wird.
GESCHENK! Jeder, der diesen Indikator kauft, erhält einen Roboter als Geschenk https://www.mql5.com/en/market/product/82924