Gann 9 plus
- Indikatoren
- Yin Zhong Peng
- Version: 2.42
- Aktualisiert: 12 März 2023
- Aktivierungen: 10
Gann 9+ Indicator Introduction
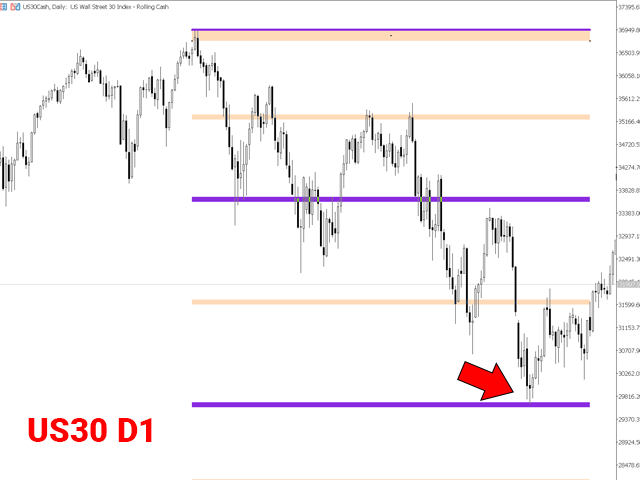
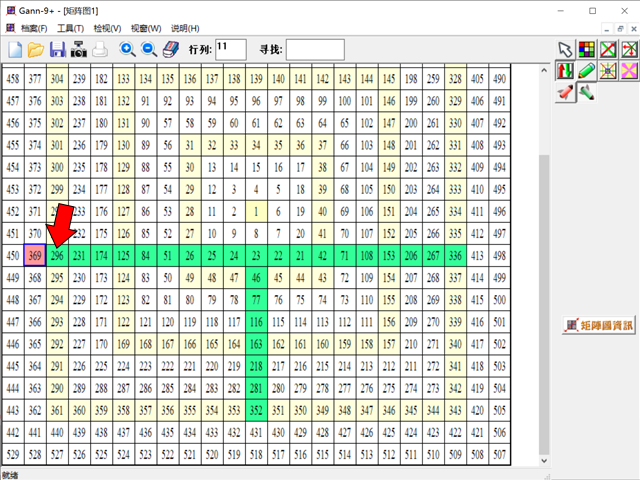
The "Gann Matrix Chart" is the most simple and clear technical analysis in Gann theory, which is the calculation tool that Gann has always been committed to using. It is the essence of Gann's whole life. The Gann 9+ indicator uses the matrix chart to find the future high or low points of stocks or futures.
Indicator Input:
-
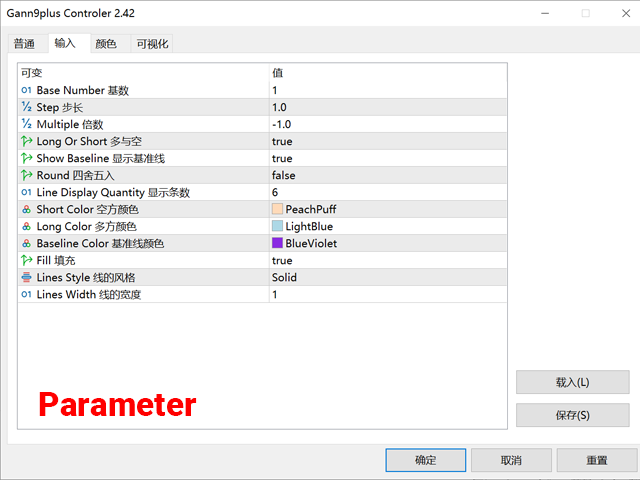
The base and step size can be set as 1 by default;
-
When the multiple is -1, the multiple will be automatically obtained, or it can be filled in manually; (The price divided by the multiple is the starting value)
-
Long and short represent calculating the target price upwards or downwards from the starting point;
-
Indicates whether to display the benchmark line;
-
The starting value is the price divided by the multiple, whether to round off the starting value;
-
Indicates how many target prices to display.
Trading method suggestion:
-
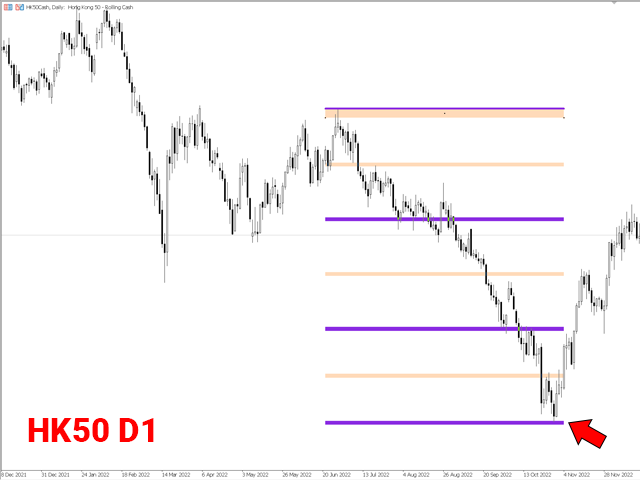
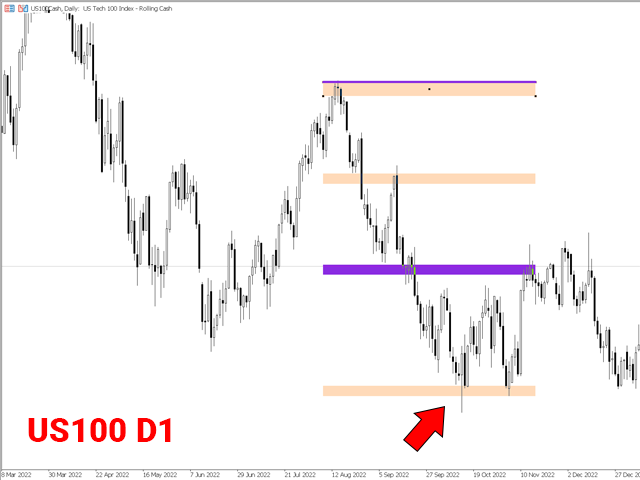
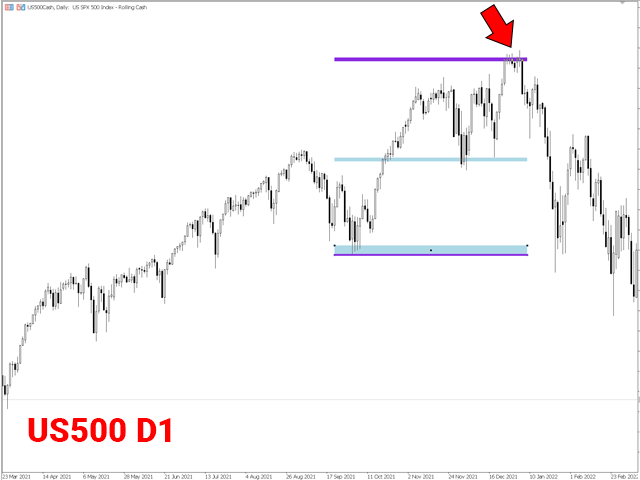
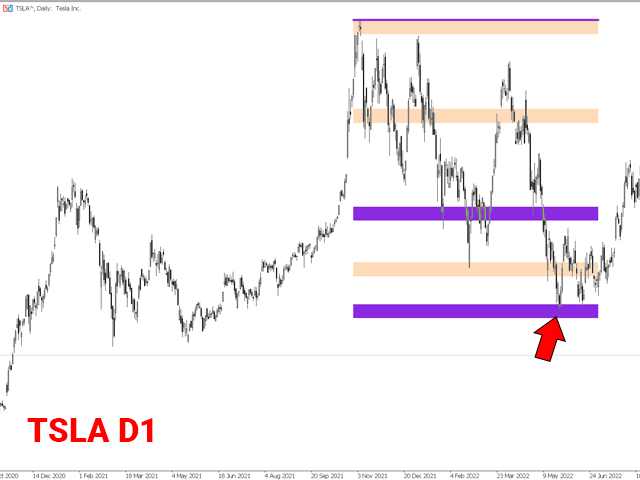
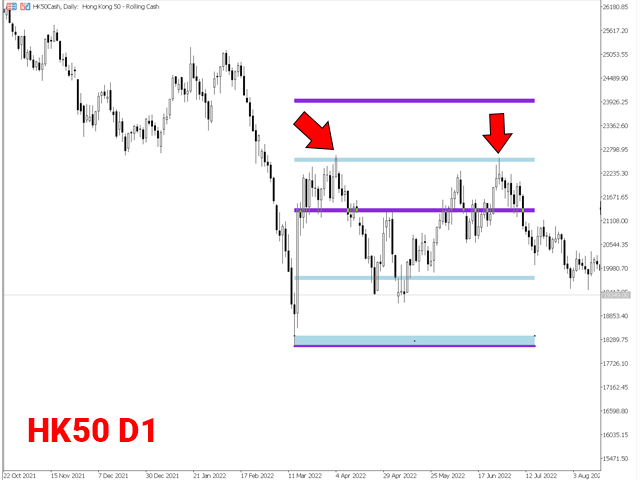
The lines drawn will have obvious support and resistance, even reversals. After breaking through, add positions and reduce positions after reaching them;
-
Match with other scalp and oscillation indicators to greatly increase the success rate;
-
Try to use it as a main/auxiliary indicator, but do not just rely on one indicator.
Special note: This indicator is intended for use by individuals who have a certain understanding of Gann theory.

