Stochastic RSI Alerts
- Indikatoren
- Javier Morales Fernandez
- Version: 1.0
- Aktivierungen: 5
Was ist der stochastische RSI?
Der stochastische RSI (StochRSI) ist ein Indikator, der in der technischen Analyse verwendet wird. Er bewegt sich zwischen null und eins (bzw. null und 100 bei einigen Charting-Plattformen) und wird durch Anwendung der Stochastik-Oszillatorformel auf eine Reihe von Relative-Stärke-Index-Werten (RSI) und nicht auf Standardkursdaten erstellt. Diese Version enthält Warnungen, damit Sie keine wirklich guten Gelegenheiten verpassen. Sie legen den Parameter fest, wann Sie ein Kauf- oder Verkaufssignal erhalten möchten. Um ein Signal zu erhalten, müssen Sie Ihre Desktop-Version mit der Metatrader-App über die MetaQuotes-ID verbinden. Die MetaQuotes ID finden Sie in Ihrer MT4/5 App unter Einstellungen >>>Chat und Nachrichten. Auf dem Desktop finden Sie die ID unter Tool>>>Option>>>Benachrichtigungen, wenn Sie die ID in der Desktop-Version eingeben und die Benachrichtigungen aktivieren.
Probieren Sie die MT5-Version HIER aus
Weil Stil wichtig ist
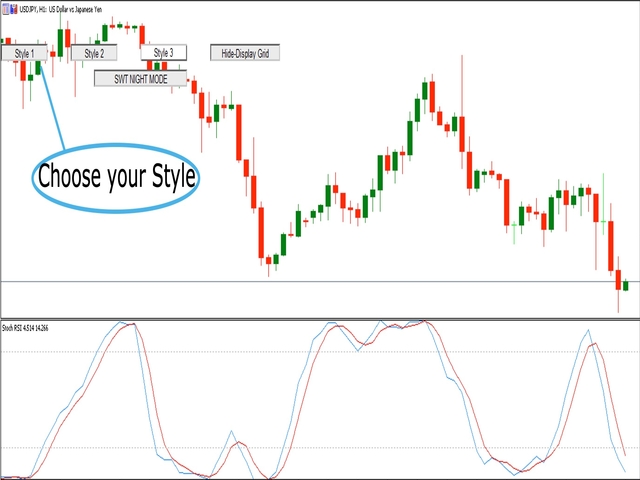
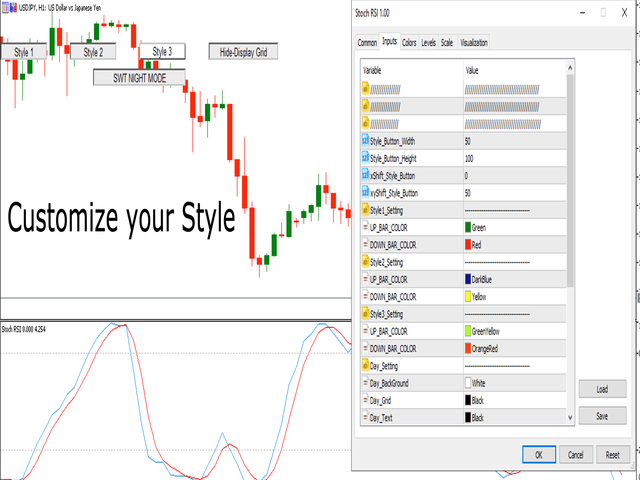
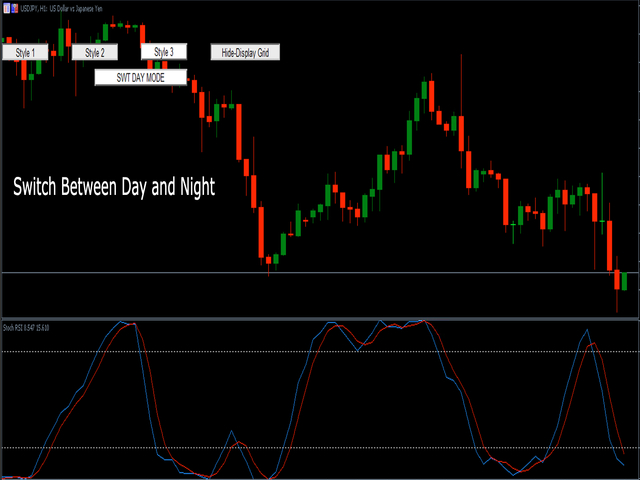
Ich weiß, wie lästig es ist, jedes Mal auf die Eigenschaften zu klicken, um die Farbe der Kerze zu ändern, den Hintergrund hell oder dunkel zu machen und das Gitter einzufügen oder zu entfernen. Hier ist die Lösung mit nur einem Klick:
- Drei anpassbare Schaltflächen zur Auswahl des Kerzenstils, den Händler wünschen.
- Eine Schaltfläche zum Umschalten zwischen Tag- und Nachtmodus.
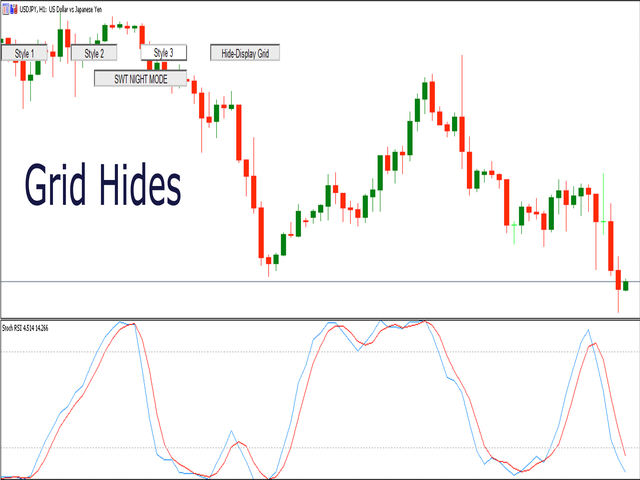
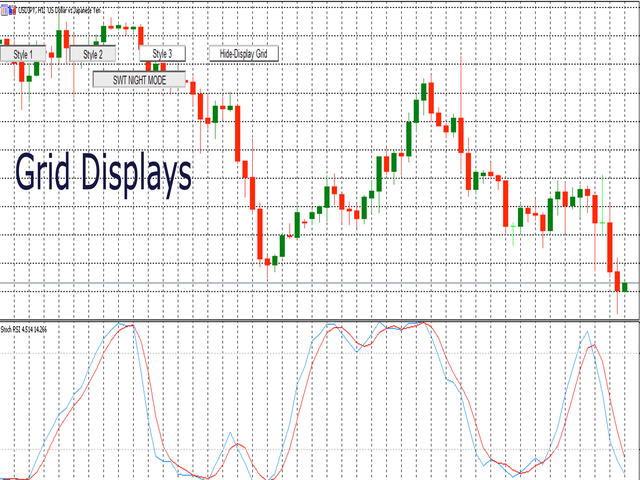
- Eine Schaltfläche zum Ein- und Ausblenden des Gitters in den Charts.
*****In den Einstellungen können Sie wählen, wo die Schaltflächen auf dem Bildschirm angezeigt werden sollen*****
Sehen Sie sich auch meine anderen Produkte an https://www.mql5.com/en/users/javimorales.fer/seller
Autor
Javier Morales, Gründer von Algorithms for Trading.