TrukhinREAL
- Indikatoren
- Andrei Trukhin
- Version: 1.40
- Aktualisiert: 15 Oktober 2022
- Aktivierungen: 10
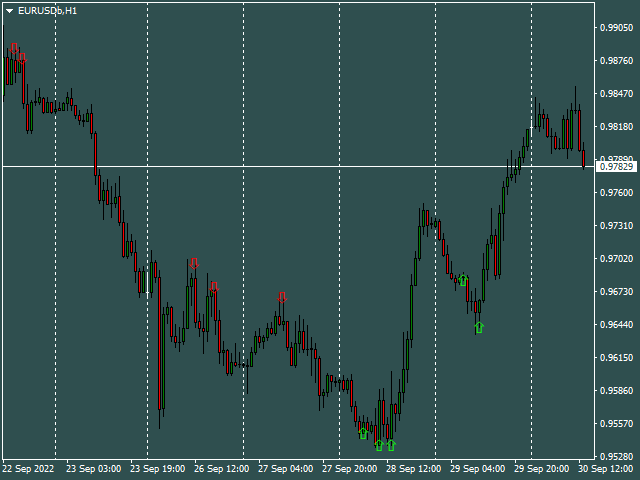
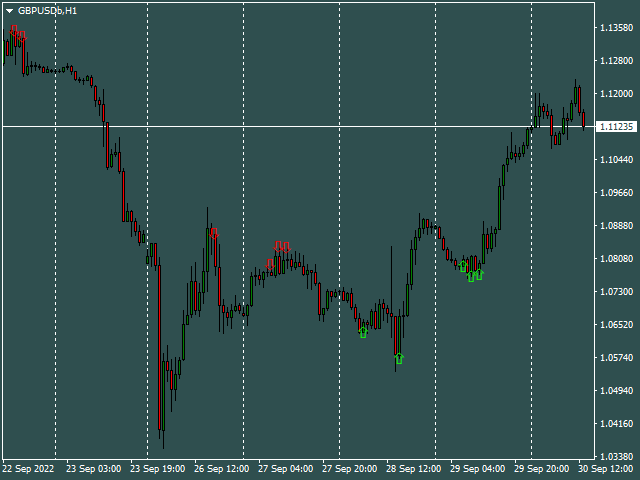
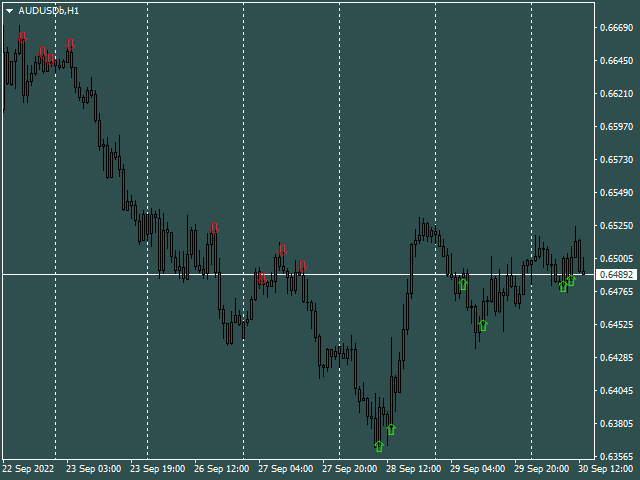
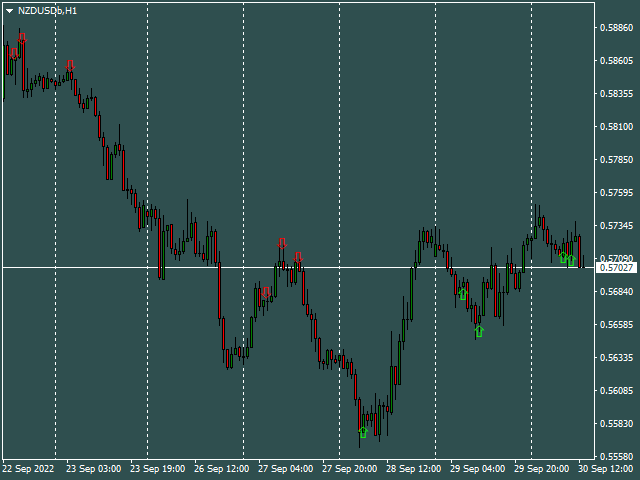
This indicator is designed for those people who want to trade and earn on any instruments and timeframes.The indicator gives out very good points to enter the market,it is very easy to trade,the arrows will show when to open trades,set and trade without thinking about anything,stop loss and take profit, set each one yourself,it all depends on your trading style,someone scalps and someone holds trades on a few days.In the strategy tester, the indicator simply cannot physically show accurate results, because of a very complex algorithm, which strategy tester simply cannot physically calculate.