Impulse Creative
- Indikatoren
- Tatiana Savkevych
- Version: 1.0
- Aktivierungen: 5
Impulse Creative is a more advanced indicator of impulses for making decisions (compared to the Impulse Change indicator). The main task of this indicator is to warn the trader about the moment of price changes and also to give a command to enter according to the current trend. To determine the trend, use any other tool, this development forms only an entry point but not the entry direction.
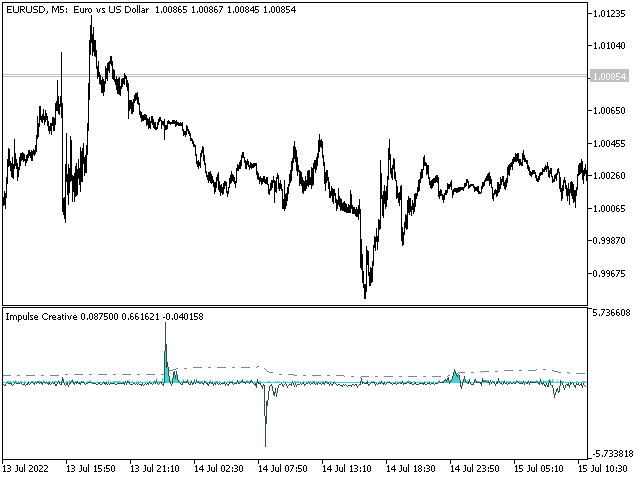
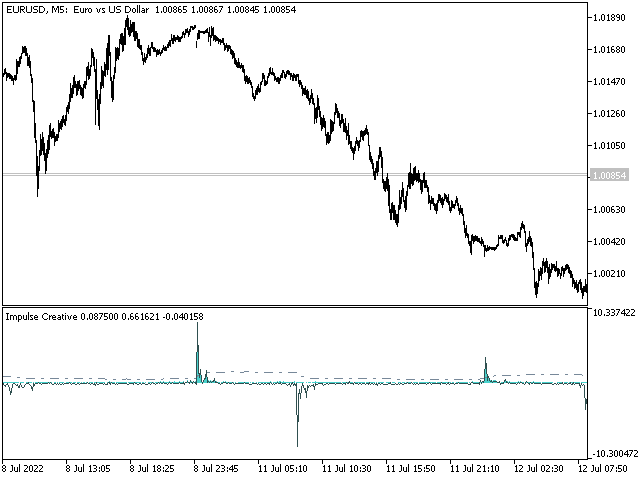
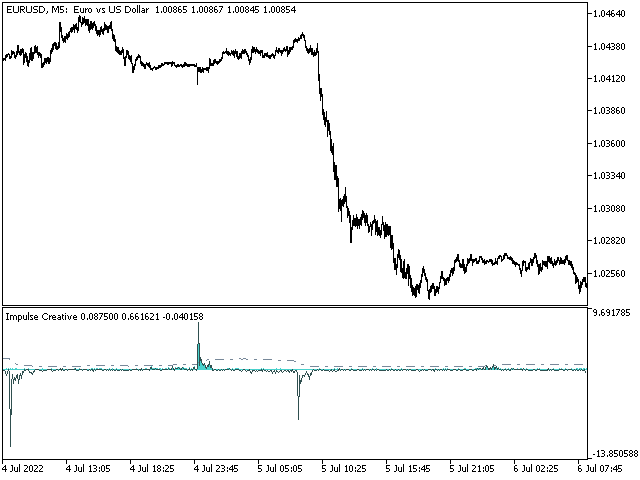
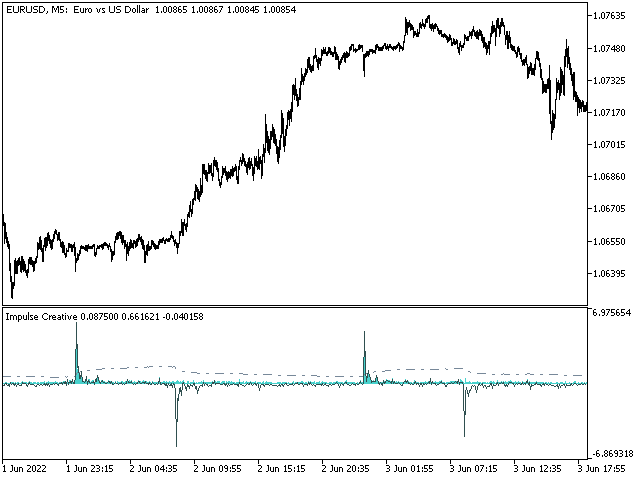
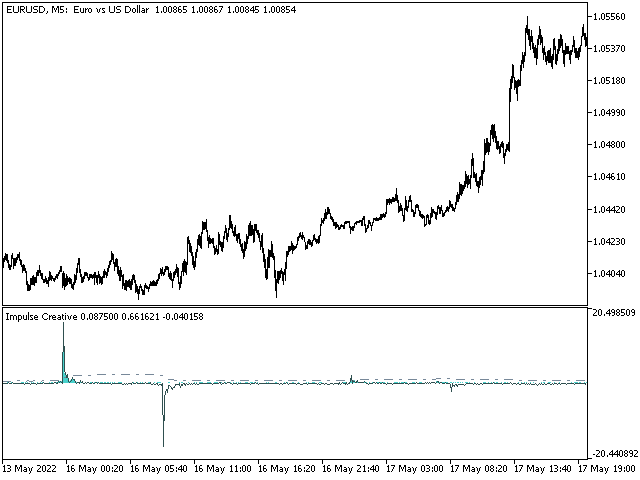
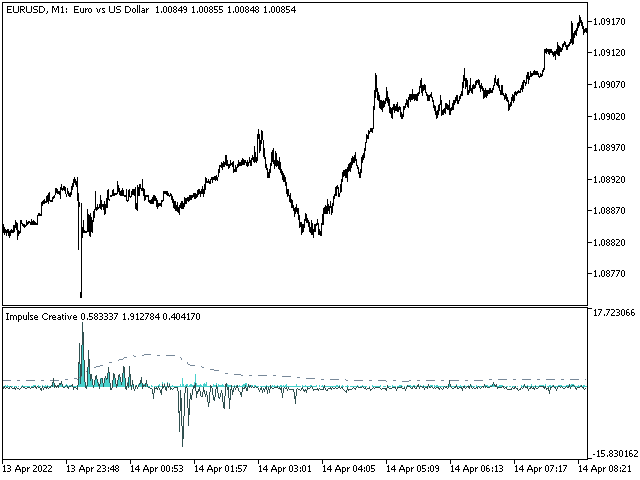
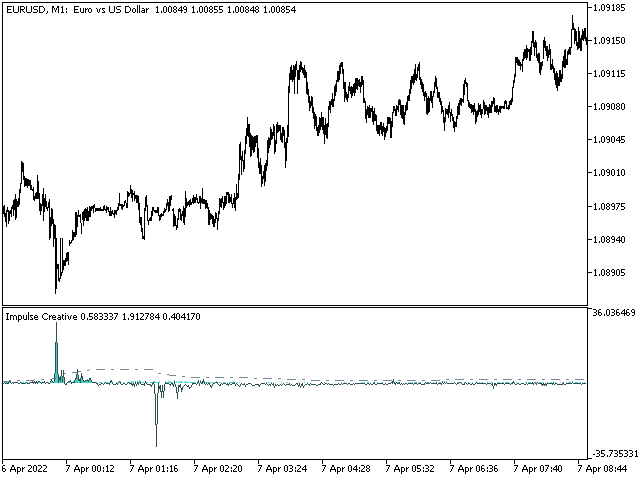
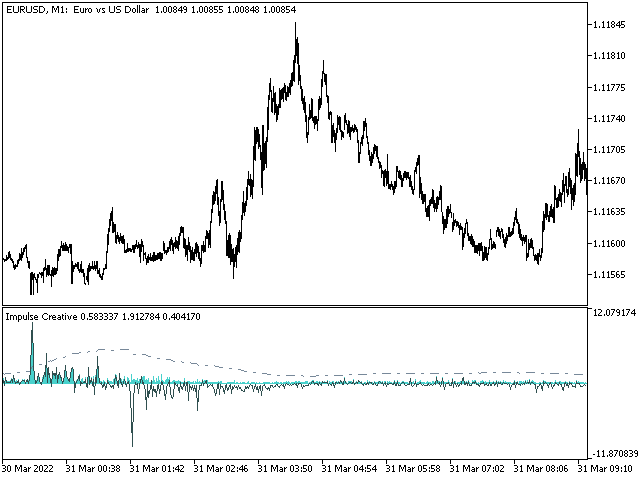
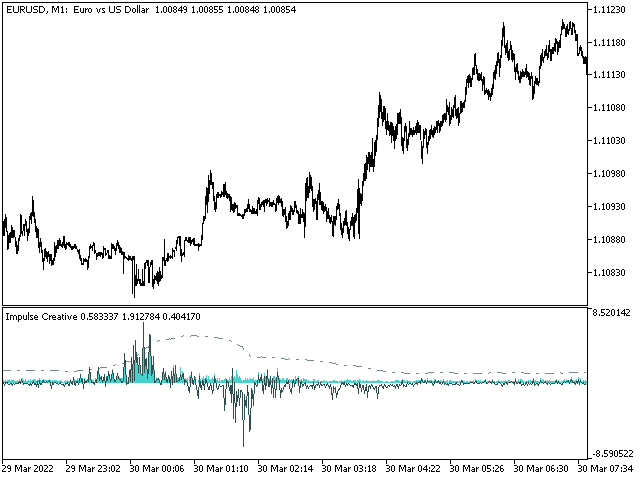
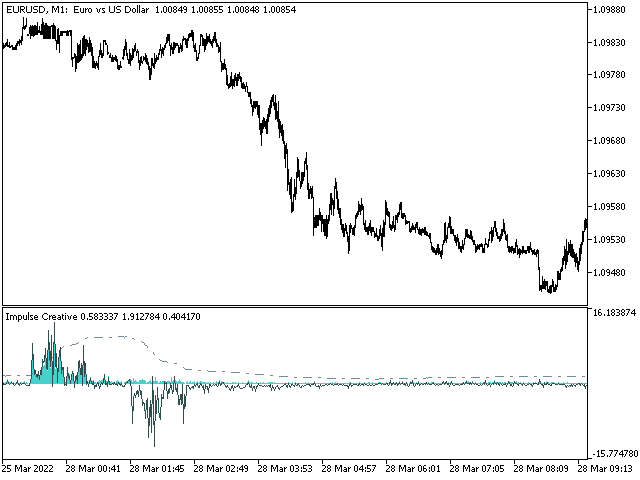
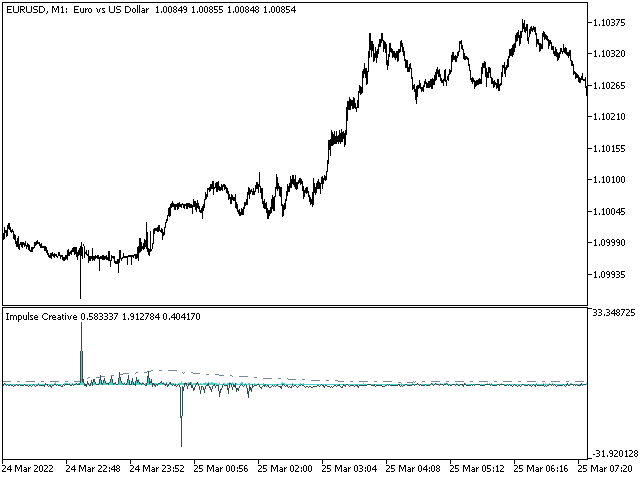
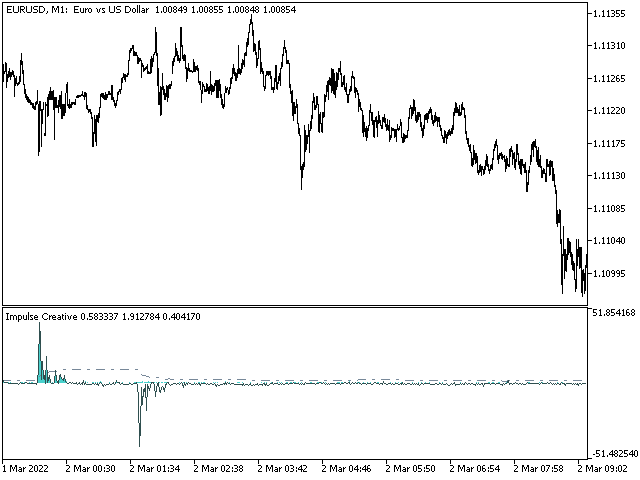
First, look at the screenshots and notice that we see clearly expressed figures that the indicator forms and after which! there is an active movement of the market, and often in one direction, well, or a significantly volatile movement in both directions. It can be seen that after the impulse, the price moves dynamically or smoothly but in one direction. The note. The smaller the timeframe, the more frequent and stronger the impulses, the higher the timeframe, the stronger the impulses are smoothed out. Let's focus on the basics. The indicator has 4 settings:
- AvgBase - impulse (it can be averaged but it is desirable to leave the setting equal to 1). This setting is responsible for displaying the histogram on the chart, that is, the impulse itself.
- AvgLevel - strongly smoothed impulse. Its essence is to form a reaction line (dashed line on the graph). That is, such a line that the user can react to in the following way. If the histogram is above this line - this is the intersection of a certain limit level, which is a signal for making a decision! That is the entry point! And already by adjusting this parameter (for each timeframe a new setting) we can achieve the best reaction for a certain timeframe of a certain instrument.
- Activity - Serves to increase the value generated by the AvgLevel parameter to a certain synchronization with the impulse values generated by the AvgBase parameter. It plays a role for signal formation, it also needs to be configured.
- Amplifier - Serves to increase the value displayed by the third line on the chart and showing the difference between the last two values of the line formed by the AvgLevel parameter and actually displaying the strength of the line slope angle. That is, the greater the slope of the dashed line, the stronger the last solid line is directed up or down, depending on the direction of the dashed line. It is used as a filter, namely, when this modulo line is above a certain value (we determine it ourselves), all signals are discarded.
Also, this indicator can be interpreted in any other way, if someone finds a more interesting interpretation, please let me know. Please note that always after the main upward impulse of the histogram, after some time, the second impulse of the already solid line downwards is formed. This effect has not yet been studied and requires a deeper analysis for a better interpretation.
