Neural Predictor MT4
- Indikatoren
- Evgeny Shevtsov
- Version: 2.3
- Aktualisiert: 10 November 2024
- Aktivierungen: 10
The indicator refers to the means of probabilistic analysis.
Prediction is performed by the Monte Carlo method together with a mathematical model of a neuron.
But, the modeling of samples for this method is made not artificially, but comes from the original "nature", that is, from history.
The number of samples and the detail of their modeling is achieved using the lower (relative current) timeframe.
Indicator algorithm :
In general terms, the algorithm boils down to the fact that the indicator is trained on the history of cause-samples and effect-samples, forming a kind of cumulative effect-sample, that is, a forecast.
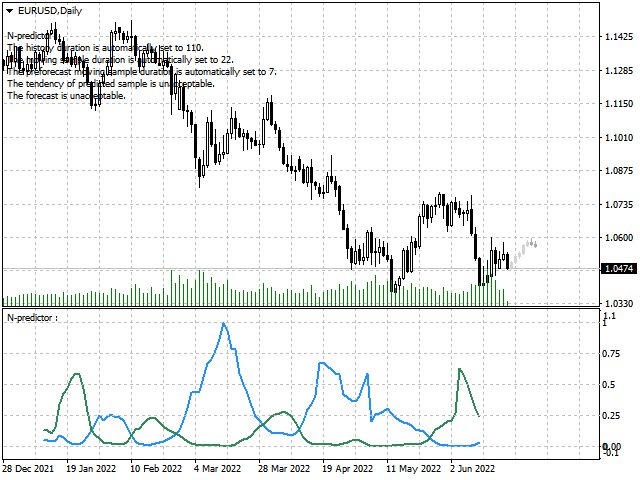
Next the generated forecast is checked for its expressed tendency, and if it satisfies, then this forecast can be taken into account.
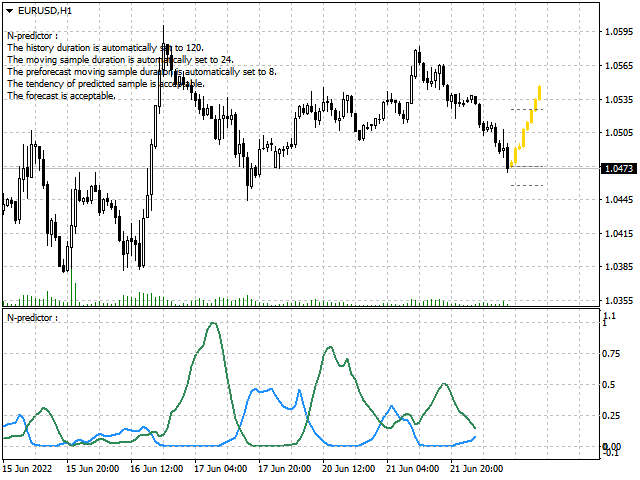
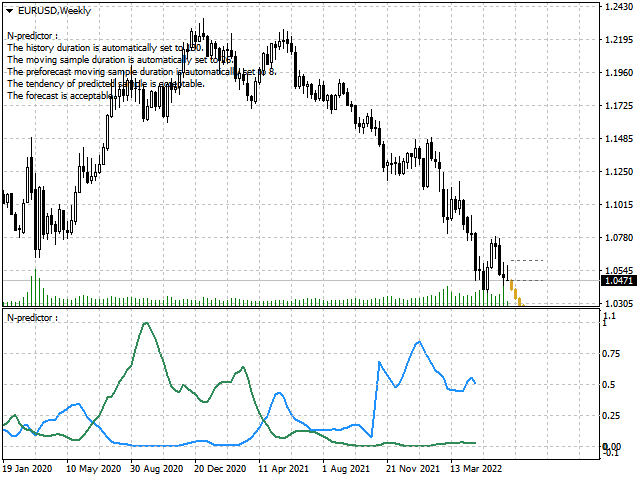
At the same time, the forecast candles are repainted in a different color, and the price levels recommended for placement stop-loss and take-profit also appear.
As an expected result in case of a correct forecast - a profitable deal brings several shares of profit.
As an expected result in case of an incorrect forecast - an unprofitable deal brings only one share of loss.
The frequency of full recalculation/retraining is equal to the frequency of the lower timeframe, which is assigned automatically, or can be selected arbitrarily via the input variable.
The duration of the learning history is also set via the input variable, and the very limitation of this duration excludes the effect of overtraining.
Usage strategy :
The opening of a trading position is carried out according to the forecast, which is displayed by yellow candles.
If a trading position has closed at stop-loss, but the previous forecast continues to exist, then you just need to open a position again.
You should hold an opened trading position no longer than the duration of the forecast, that is, no longer than the ForecastDuration distance (see below).
Use this product only as an auxiliary tool of your trading strategy.
In other words, it is not recommended to use this product as a single strategy.
Input variables :
HistoryDuration - the distance learning history, is set by the number of candles of the current timeframe, if the value is set to zero it is assigned automatically.
MovingSampleDuration - the size (duration) of samples, is set by the number of candles of the current timeframe, if the value is set to zero it is assigned automatically.
ForecastDuration - the size (duration) of forecast, is set by the number of candles of the current timeframe, if the value is set to zero it is assigned automatically.
ForecastRangeMultiplier - the multiplier for the forecast amplitude.
ForecastAcceptableTendency - the value of acceptable forecast tendency, is set in ATR-s.
AverageRangeDuration - the period for calculating the ATR value, is set by the number of candles of the current timeframe, if the value is set to zero it is automatically assigned to HistoryDuration.
AverageRangeMultiplier - the multiplier for the ATR value.
ChartMessage - enabling/disabling the message on the chart window.
AlertMessage - enabling/disabling the alert message about the forecast acceptability.
PushMessage - enabling/disabling the push message about the forecast acceptability.
LowerTimeframe - lower timeframe.
VolumesType - volumes type.
The other input variables relate to the color settings and its purpose is clear from its name.
Indicator buffers :
PredictedHighValues - high price values of predicted candles.
PredictedLowValues - low price values of predicted candles.
PredictedOpenValues - open price values of predicted candles.
PredictedCloseValues - close price values of predicted candles.
PredictedVolumeValues - volume column values of predicted candles.
The indicator buffers are not displayed on the chart (the default color is None), because they are intended only when the indicator is called from the outside.
The example code for calling the indicator and checking the acceptability of the forecast tendency value is attached on the "Comments" tab.
Note :
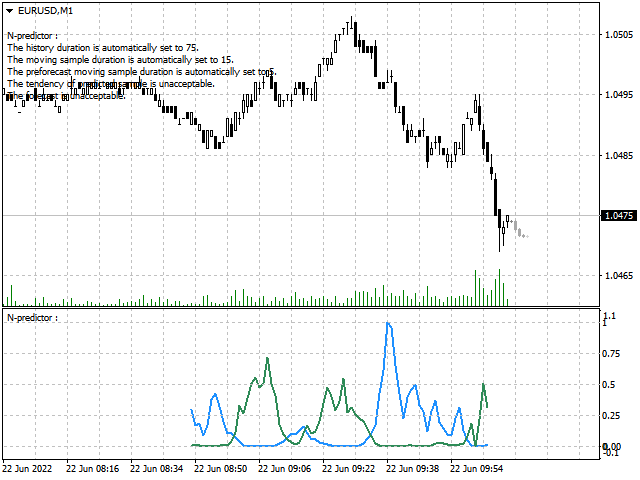
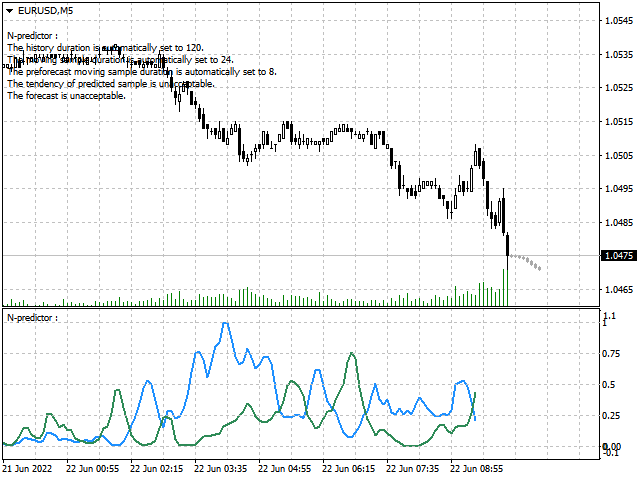
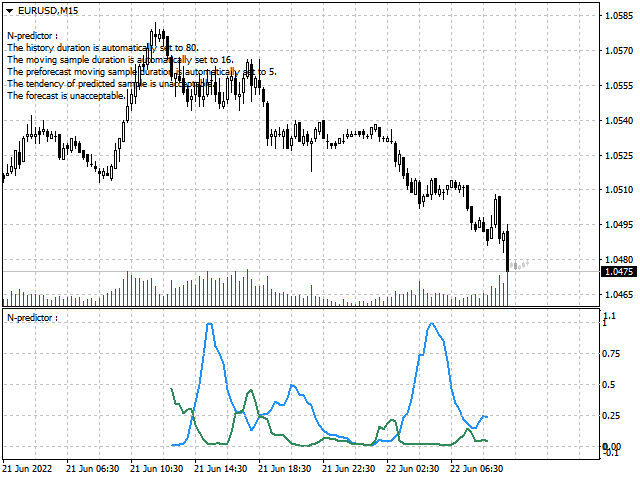
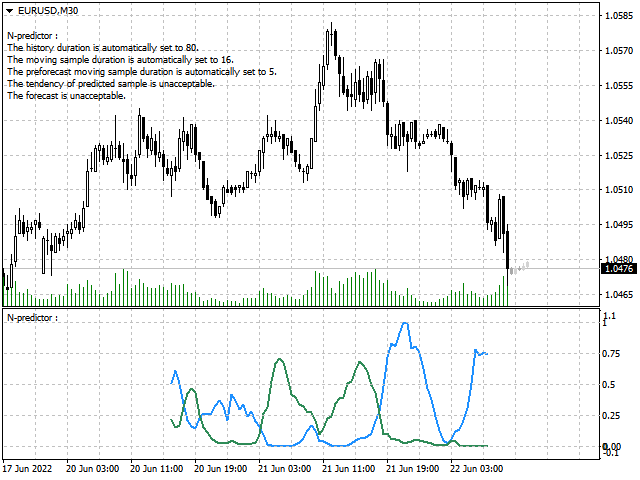
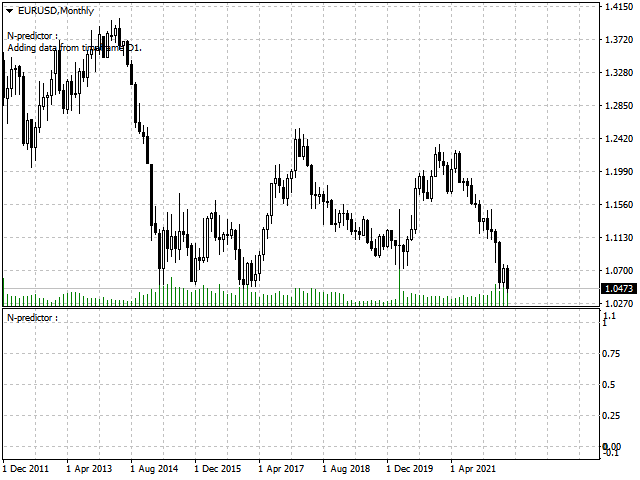
The screenshots show the engineering version of the product in the form of an indicator for the subwindow.
The final version of the product is made in the form of an indicator for the main window and displays only predicted candles.







This indicator paints and has proven to be somewhat unreliable. I did not find value with it
Using this EA, the user can check the usefulness/uselessness of this indicator on a certain timeframe of a certain trading symbol in the strategy tester.
This is also possible for the trial-version of the indicator.