• Übersicht
  • Bewertungen (1)
  • Diskussion (6)

KT SSL Indicator MT4

5
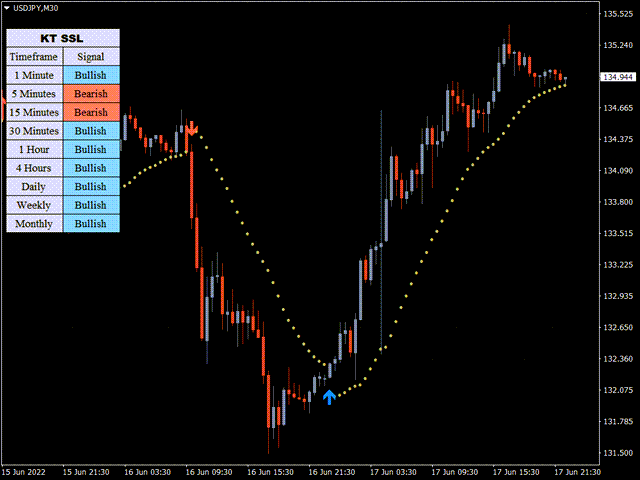
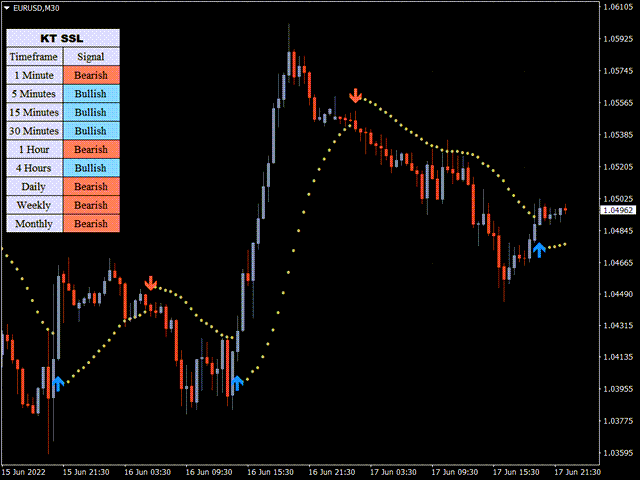
SSL steht für Semaphore Signal Level Channel. Es besteht aus zwei gleitenden Durchschnitten, die jeweils auf das Hoch und das Tief der Kerzen angewendet werden, um einen trendfolgenden Preiskanal zu bilden.
  • Kaufsignal: Wenn der Schlusskurs über der oberen gleitenden Durchschnittslinie liegt.
  • Verkaufssignal: Wenn der Schlusskurs unter der unteren gleitenden Durchschnittslinie liegt.

Funktionen

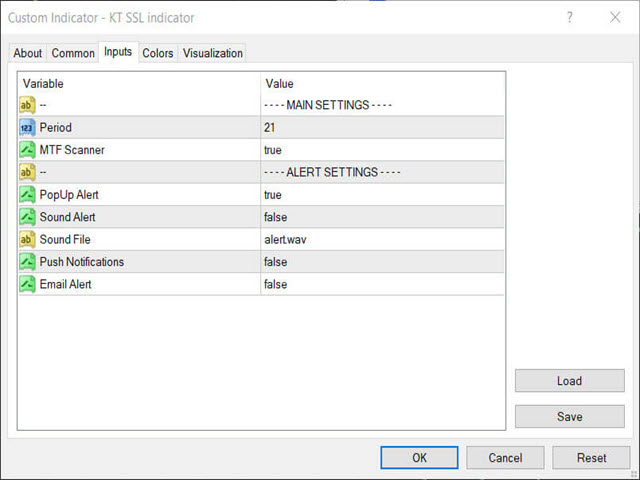
  • Verfügt über einen Multi-Timeframe-Scanner, der neue Signale über alle Zeitrahmen hinweg erkennt.
  • Eine einfache, benutzerdefinierte Umsetzung des klassischen SSL-Kanals, mit der sich die Trendrichtung schnell identifizieren lässt.
  • Alle MetaTrader-Benachrichtigungen sind integriert.

SSL-Formel

  • Obere Linie: Gleitender Durchschnitt, der auf das Hoch der Kerzen angewendet wird.
  • Untere Linie: Gleitender Durchschnitt, der auf das Tief der Kerzen angewendet wird.

  • Kauf-Einstieg: Wenn der Schlusskurs über der oberen SSL-Linie liegt.
  • Kauf-Ausstieg: Wenn der Schlusskurs unter die untere SSL-Linie fällt.

  • Verkauf-Einstieg: Wenn der Schlusskurs unter der unteren SSL-Linie liegt.
  • Verkauf-Ausstieg: Wenn der Schlusskurs über der oberen SSL-Linie liegt. 
Bewertungen 1
Daniel Molina Olmedo
198
Daniel Molina Olmedo 2025.04.22 17:58 
 

One of the best trend indicators. I really appreciate your work with this easy-to-use indicator. Thank you so much for this wonderful indicator and especially for your kind support. Best regards.

Empfohlene Produkte
Pin Bars
Yury Emeliyanov
5 (3)
Hauptzweck: "Pin Bars" wurde entwickelt, um Pin Bars auf Finanzmarktdiagrammen automatisch zu erkennen. Eine Stiftleiste ist eine Kerze mit einem charakteristischen Körper und einem langen Schwanz, die eine Trendumkehr oder -korrektur signalisieren kann. Funktionsweise: Der Indikator analysiert jede Kerze auf dem Diagramm und bestimmt die Größe von Körper, Schwanz und Nase der Kerze. Wenn eine Stiftleiste erkannt wird, die vordefinierten Parametern entspricht, markiert der Indikator sie auf de
FREE
KT Chop Zone MT4
KEENBASE SOFTWARE SOLUTIONS
Es ist allgemein bekannt, dass sich die Finanzmärkte nur etwa 30 % der Zeit in einem klaren Trend befinden, während sie die restlichen 70 % in einer Seitwärtsbewegung (Range) verharren. Für viele Anfänger ist es jedoch schwierig zu erkennen, ob der Markt gerade trendet oder sich in einer Range befindet. KT Chop Zone löst dieses Problem, indem es die aktuelle Marktphase deutlich in drei Zonen unterteilt: Bärische Zone, Bullische Zone und Chop-Zone (Seitwärtszone). Funktionen Verbessern Sie Ihr T
This indicator compares the pips of the current day with the average of pips made in the previous three days. The "Percentage today range" is red if today's figure is less than the range of the previous three days, but turns green when the percentage exceeds 100%. When the range exceeds 100% there are good trading opportunities because we are in the presence of increased volatility of the past three days. Best use with Banks Day Levels indicator. Parameters settings corner (indicator display po
Note: this product is a free limited version of the full featured product Currency Timeframe Strength Matrix . It only includes AUD, CAD, CHF currencies instead of all 8 currencies. It includes only 5S, 1M, 5M time frames instead of all 8 (5S, 1M, 5M, 15M, 30M, 1H, 4H, 1D). What is it? The Currency TimeFrame Strength Matrix is a simple and comprehensive Forex map that gives a snapshot of what is happening in the Forex market at the very present time. It illustrates the strength and momentum ch
FREE
Easy Quick Review
Sivaramakrishnan Thavasi
This tool helps you to find easily and clearly  when you enter trade with day time  and price  examples Entered Buy at Monday 20:30 with price 2150 Exited buy at Tues 10: 30  with price  2187  You can convert as local time by inputting shift hours and minutes. Trading is a learning skill, so you have to evaluate your trading performance at the end of your day. Did you follow your rules? If you did then it was a win, regardless if you earned pips or not. If you didn't follow my rules then is a
This indicator plots in the candles the divergence found in the selected indicator and can also send a notification by email and / or to the cell phone. Works on all TIMEFRAMES. Meet Our Products   He identifies the divergences in the indicators: Relative Strength Index (RSI); Moving Average Convergence and Divergence (MACD); Volume Balance (OBV) and;. iStochastic Stochastic Oscillator  (STOCHASTIC). It is possible to choose the amplitude for checking the divergence and the indicator has to b
FREE
Indicator ini berdasarkan Gain ADX - Follow Trend - Disertai Pivot, Support & Resistant Daily Dengan indicator ini semoga menjadikan indicator yang porofit able, selama mengikuti signal yang tampil, apabila berwarna Hijau siap2 untuk Buy, dan berwarna Merah siap2 untuk Sell. Akan tampil signal Sell/Buy di saat gain mencukupi, baik TF Kecil maupun TF Besar TF Besar / High TF adalah Trend Kuat TF Kecil / Low TF adalah Trend Lemah Open Posisi pada High TF, signal akan menunjukkan Sell/Buy.
FREE
The indicator allows you to trade binary options. The recommended time frame is М1 and the expiration time is 1 minute. The indicator suitable for auto and manual trading. A possible signal is specified as a arrows above/under a candle. You should wait until the candle closes! Arrows are not re-painted Trade sessions: TOKYO section (Half end) and LONDON section (First half) Currency pairs: EUR/USD Working time frame: M1 Expiration time: 1 minute. The indicator also shows good results when using
FREE
Fair Value Gap Void MT4 The Fair Value Gap and Void (FVG + Void) indicator is a powerful tool designed for ICT and Smart Money traders who aim to detect and analyze price gaps and fair value gaps (FVGs) on the MetaTrader 4 (MT4) platform. This indicator effectively pinpoints bullish imbalances, marking them with green rectangles, while bearish imbalances are displayed using brown rectangles. As price revisits these areas and begins filling the existing orders, the indicator dynamically updates
FREE
Head and Shoulders Pattern Indicator - Your Key to Recognizing Trend Reversals Unlock the power of pattern recognition with the "Head and Shoulders Pattern Indicator." This cutting-edge tool, designed for MetaTrader, is your trusted ally in identifying one of the most powerful chart patterns in technical analysis. Whether you're a novice or an experienced trader, this indicator simplifies the process of spotting the Head and Shoulders pattern, allowing you to make informed trading decisions. Key
FREE
CycleIdentifier
Amyr Shryf Mhmd Salh
The Cycle Identifier MT4 indicator is a great choice of custom indicator for both short-term and long-term traders. The Cycle Identifier MT4 generates filtered price action signals to assist traders to identify when the conditions are right to open buy and sell positions. How it works The Cycle Identifier MT4 indicator displays on a separate indicator chart below the main chart where it draws an oscillating gray line. This gray line is characterized by upward and downward spikes that are accompa
Добрый День, всем привет, здравствуйте. Я. трейдер, 20 лет опыта, Вадим Сергеевич Лепехо. Создал этот индикатор на базе уже готового стрелочного индикатора (arrrows_template). Решил с вами поделиться  с наработками. Данный индикатор рисует стрелки по стратегии: "Тринитти". Индикатор выдает сигнал на вход когда rsi ниже 50; AO ниже 0; и Price ниже MA9-ход делаем вниз.  Индикатор выдает сигнал на вход когда rsi выше 50; AO выше 0; и Price выше MA9-ход делаем вверх. Предлагаю на демо-счете протести
FREE
The indicator allows you to trade binary options. The recommended time frame is М1 and the expiration time is 1 minutes. The indicator suitable for auto and manual trading. A possible signal is specified as a arrows above/under a candle. You should wait until the candle closes! Arrows are not re-painted Trade sessions: London and New York section Currency pairs: AUD/CAD Working time frame: M1 Expiration time: 1 minute The indicator also shows good results when using the martingale strategy - "Ma
FREE
Extremum Reverse Bar
Yurij Izyumov
2.8 (5)
This indicator has been created for finding the probable reversal points of the symbol price. A small candlestick reversal pattern is used it its operation in conjunction with a filter of extremums. The indicator is not redrawn! If the extremum filter is disabled, the indicator shows all points that have a pattern. If the extremum filter is enabled, the condition works – if the history Previous bars 1 candles back contains higher candles and they are farther than the Previous bars 2 candle, such
FREE
MarketSessions Indikator Das unverzichtbare Werkzeug zur Visualisierung globaler Marktsessions Der MarketSessions-Indikator ist ein leistungsstarkes MT4-Tool, das Tradern hilft, die wichtigsten Forex-Marktsessions direkt auf ihren Charts zu visualisieren. Durch die klare Darstellung der aktiven Handelszeiten der Märkte in Sydney, Tokio, London und New York unterstützt dieser Indikator Sie dabei, optimale Handelsperioden zu identifizieren und Marktvolatilitätsmuster zu verstehen. Hauptfunktionen:
FREE
TrendPlus
Sivakumar Subbaiya
4.07 (14)
Trend Plus   Trendplus  Indicator   Time Frame: Suitable for any time frame.  Purpose: Trend Prediction. Blue and red candle indicate the buy and sell call respectively. Buy: When the blue candle is formed buy call is initiated. close the buy trades when the next red candle will formed.   Sell: When the Red candle is formed Sell call is initiated. close the Sell trades when the next blue candle will formed.   Happy trade!!
FREE
Ticks ADX 4
Andrej Nikitin
The Average Directional Movement Index indicator drawn using a tick chart. After launching it, wait for enough ticks to come. Parameters: Period - period of averaging. Сalculated bar - number of bars on the chart for the indicator calculation. Buffer indexes: 0 - MAIN_LINE, 1 - PLUSDI_LINE, 2 - MINUSDI_LINE.
Current Trade Profit
Boguslaw Nejmanowski
Current Pips and Money Profit This indicator displays the results of the currently open position on the graph. Result in pips and in the invoice currency. Thanks to this, you can enlarge the chart to the entire screen and have control over the result of trading without opening a terminal window which takes a space of a screen. The display positions of this data can be adjusted at the user's discretion and colors also.
FREE
Previous Candle Levels MT4
Wachinou Lionnel Pyrrhus Sovi Guidi
WaPreviousCandleLevels MT4 shows the previous candle levels, it shows the previous candle Open High Low Close levels (OHLC Levels) in different time frame. It's designed to help the trader to analyse the market and pay attention to the previous candle levels in different time frame.  We all know that the OHLC Levels in Monthly, Weekly and Daily are really strong and must of the time, the price strongly reacts at those levels. In the technical analysis, the user can use them as a support and res
FREE
Cracking Correlation ICT Indicator MT4 The Cracking Correlation Indicator is built to identify correlation shifts among three financial assets, such as DJI, ND100, and SP500. Typically, closely correlated instruments move in tandem, but occasionally, this correlation weakens or breaks. This ICT MetaTrader 4 indicator visually represents these correlation shifts using color-coded lines. «Indicator Installation & User Guide» MT4 Indicator Installation  |  Cracking Correlation ICT Indicator MT5  
FREE
The indicator allows you to trade binary options. The recommended time frame is М1 and the expiration time is 1,2,3 minutes. The indicator suitable for auto and manual trading. A possible signal is specified as a arrows above/under a candle. You should wait until the candle closes! Arrows are not re-painted Trade sessions: TOKYO section (Half-end) Currency pairs: USD/JPY Working time frame: M1 Expiration time: 1,2,3 minutes. The indicator also shows good results when using the martingale strateg
FREE
The indicator allows you to trade binary options. The recommended time frame is М1 and the expiration time is 1 minutes. The indicator suitable for auto and manual trading. A possible signal is specified as a arrows above/under a candle. You should wait until the candle closes! Arrows are not re-painted Trade sessions: London and New York section Currency pairs: EUR/GRB Working time frame: M1 Expiration time: 1 minute The indicator also shows good results when using the martingale strategy - "M
FREE
PREVIOUS INDICATOR’S DATA MA CROSSOVER https://www.mql5.com/en/users/earobotkk/seller#products P/S: If you like this indicator, please rate it with 5 stars in the review section, this will increase its popularity so that other users will be benefited from using it. This indicator notifies and draws an arrow on the chart whenever    the MA line has crossed over its previous indicator’s data MA filtered by MA Trend.   It also displays total pips gained from all the entry set-ups. Setting ·   You c
FREE
Tiks ATR 4
Andrej Nikitin
The  Average True Range (ATR)  indicator drawn using a tick chart. After launching it, wait for enough ticks to come. Parameters: ATR Period  - number of single periods used for the indicator calculation. The number of ticks to identify Bar  - number of single ticks that form OHLC. Price levels count  - number of displayed price levels (no levels are displayed if set to 0 or a lower value). price mode  - choice of prices under calculation (can be bid, ask or average). Сalculated bar  - number of
The indicator allows you to trade binary options. The recommended time frame is М1 and the expiration time is 1 minute. The indicator suitable for auto and manual trading. A possible signal is specified as a arrows above/under a candle. You should wait until the candle closes! Arrows are not re-painted Trade sessions: LONDON and NEWYORK section Currency pairs: GRB/USD Working time frame: M1 Expiration time: 1 minute. The indicator also shows good results when using the martingale strategy - "Mar
FREE
Engulfing Pattern is a free indicator available for MT4/MT5 platforms, its work is to provide "alerts" when a "Bullish" or "Bearish engulfing pattern forms on the timeframe. This indicator comes with alerts options mentioned in the parameter section below. Join our   MQL5 group , where we share important news and updates. You are also welcome to join our private channel as well, contact me for the private link. Engulfing Pattern Indicator MT5 Other Products Try our Martini EA with 2 years of liv
FREE
Investment Castle Engulfing MT4
Ahmed Alaaeldin Abdulrahman Ahmed Elherzawi
Whether you are a scalper or daily trader, you will always look for bullish / bearish engulfing candles. This can be a bit tricky and stressful when you try to visually identify the engulfing candles on the chart. Not only that, you might be trading on the M15 time frame but the engulfing candle is forming or has already formed in the H4 time frame. This indicator is made to do that on your behalf. You can trade on any time frame and see Engulfing candles of another time frame, this means that y
FREE
This simple indicator paints with a darker color on the volume bar when the quantity traded is above the average of select number of periods of the volume itself, highlighting the moments when there was a large volume of deals above the average. It is also possible to use a configuration of four colors where the color tone shows a candle volume strength. The indicator defaults to the simple average of 20 periods, but it is possible to change to other types of averages and periods. If you like t
FREE
Trend Gap Indicator
Roberto Alexander Quan
A Gap often occurs when the price moves with "strength" in a given direction (either up or down).  This Gap is formed when, in looking at 3 consecutive candles, the wicks of the 1st and 3rd candles do not overlap.  When this happens, the indicator creates a rectangle where the Gap is located. It identifies a zone where the price could potentially go back to (mitigation).   The Gap/rectangle is mitigated when the price returns and completely covers the rectangle. Note that the indicator also show
DeMarker Jurik
Augustine Kamatu
Introducing Demarker Jurik—an innovative indicator poised to revolutionize your forex trading strategy. This indicator combines the precision of custom moving averages based on the Demarker indicator with the MetaTrader 4 indicator, Demarker. Jurik moving averages are renowned for their accuracy and reliability in analyzing price movements in the forex market. They offer traders smoother representations of price action, filtering out noise and providing clearer signals for identifying trends a
FREE
Käufer dieses Produkts erwarben auch
Cycle Maestro
Stefano Frisetti
NOTE: CYCLEMAESTRO is distributed only on this website, there are no other distributors. Demo version is for reference only and is not supported. Full versione is perfectly functional and it is supported CYCLEMAESTRO , the first and only indicator of Cyclic Analysis, useful for giving signals of TRADING, BUY, SELL, STOP LOSS, ADDING. Created on the logic of Serghei Istrati and programmed by Stefano Frisetti ; CYCLEMAESTRO is not an indicator like the others, the challenge was to interpret only t
Gann Made Easy
Oleg Rodin
4.81 (120)
Gann Made Easy ist ein professionelles und einfach zu bedienendes Forex-Handelssystem, das auf den besten Handelsprinzipien unter Verwendung der Theorie von Mr. basiert. W.D. Gann. Der Indikator liefert genaue KAUF- und VERKAUFSsignale, einschließlich Stop-Loss- und Take-Profit-Levels. Mit PUSH-Benachrichtigungen können Sie auch unterwegs handeln. Bitte kontaktieren Sie mich nach dem Kauf! Ich werde meine Handelstipps und tolle Bonusindikatoren kostenlos mit Ihnen teilen! Wahrscheinlich haben Si
Trend Screener
STE S.S.COMPANY
4.78 (93)
Trendindikator, bahnbrechende, einzigartige Lösung für Trendhandel und -filterung mit allen wichtigen Trendfunktionen in einem Tool! Es handelt sich um einen 100 % nicht neu zu malenden Multi-Timeframe- und Multi-Währungs-Indikator, der für alle Symbole/Instrumente verwendet werden kann: Forex, Rohstoffe, Kryptowährungen, Indizes und Aktien. ZEITLICH BEGRENZTES ANGEBOT: Der Support- und Resistance-Screener-Indikator ist für nur 50 $ und lebenslang verfügbar. (Ursprünglicher Preis 250 $) (Angebot
Gold Stuff
Vasiliy Strukov
4.86 (259)
Gold Stuff-Ein Trendindikator, der speziell für Gold entwickelt wurde, kann auch auf allen Finanzinstrumenten verwendet werden. Der Indikator wird nicht neu gezeichnet und verzögert sich nicht. Empfohlener Zeitrahmen H1. Nach diesem Indikator geschrieben EA Gold Stuff Berater, können Sie es in meinem Profil finden. WICHTIG! Kontaktieren Sie mich sofort nach dem Kauf, um Anweisungen und Bonus zu erhalten!   Sie können eine kostenlose Kopie unseres Strong Support- und Trendscanner-Indikators er
FX Volume
Daniel Stein
4.6 (35)
FX Volume: Erleben Sie den echten Marktüberblick aus der Sicht eines Brokers Kurzüberblick Möchten Sie Ihre Handelsstrategie auf das nächste Level bringen? FX Volume liefert Ihnen Echtzeit-Einblicke in die Positionierung von Retail-Tradern und Brokern — lange bevor verzögerte Berichte wie der COT verfügbar sind. Ob Sie nach beständigen Gewinnen streben oder einfach einen tieferen Vorteil am Markt suchen, FX Volume hilft Ihnen, große Ungleichgewichte zu erkennen, Breakouts zu bestätigen und Ihr
Scalper Inside PRO
Alexey Minkov
4.77 (64)
!SPECIAL SALE! An exclusive indicator that utilizes an innovative algorithm to swiftly and accurately determine the market trend. The indicator automatically calculates opening, closing, and profit levels, providing detailed trading statistics. With these features, you can choose the most appropriate trading instrument for the current market conditions. Additionally, you can easily integrate your own arrow indicators into Scalper Inside Pro to quickly evaluate their statistics and profitability
Algo Pumping MT4
Ihor Otkydach
5 (7)
PUMPING STATION – Ihre persönliche „All-inclusive“-Strategie Wir präsentieren Ihnen PUMPING STATION – einen revolutionären Forex-Indikator, der Ihr Trading in eine spannende und effektive Erfahrung verwandeln wird. Es handelt sich nicht nur um ein Hilfsmittel, sondern um ein vollwertiges Handelssystem mit leistungsstarken Algorithmen, die Ihnen helfen, stabiler zu traden. Beim Kauf dieses Produkts erhalten Sie KOSTENLOS: Exklusive Set-Dateien: Für automatische Einrichtung und maximale Leistung.
Advanced Supply Demand
Bernhard Schweigert
4.91 (294)
Derzeit 33% Rabatt! Die beste Lösung für jeden Anfänger oder erfahrenen Händler! Dieser Indikator ist ein einzigartiges, qualitativ hochwertiges und erschwingliches Trading-Tool, da wir eine Reihe von proprietären Funktionen und eine neue Formel integriert haben. Mit diesem Update werden Sie in der Lage sein, doppelte Zeitrahmenzonen anzuzeigen. Sie können nicht nur einen höheren TF (Zeitrahmen) anzeigen, sondern sowohl den Chart-TF als auch den höheren TF: SHOWING NESTED ZONES. Alle Supply Dema
M1 Arrow
Oleg Rodin
5 (17)
Eine Intraday-Strategie, die auf zwei Grundprinzipien des Marktes basiert. Der Algorithmus basiert auf der Analyse von Volumina und Preiswellen mit zusätzlichen Filtern. Der intelligente Algorithmus des Indikators gibt nur dann ein Signal, wenn sich zwei Marktfaktoren zu einem vereinen. Der Indikator berechnet Wellen eines bestimmten Bereichs auf dem M1-Diagramm unter Verwendung der Daten des höheren Zeitrahmens. Und um die Welle zu bestätigen, verwendet der Indikator eine Volumenanalyse. Dieser
System Trend Pro
Aleksandr Makarov
5 (2)
Special offer! https://www.mql5.com/ru/users/bossik2810 System Trend Pro - This is the best trend trading indicator!!! The indicator no repaint!!!  The indicator has   MTF   mode, which adds confidence to trading on the trend (   no repaint   ). How to trade? Everything is very simple, we wait for the first signal (big arrow), then wait for the second signal (small arrow) and enter the market in the direction of the arrow. (See screens 1 and 2.) Exit on the opposite signal or take 20-30 pips,
Currency Strength Exotics
Bernhard Schweigert
4.88 (32)
Stärke von 8 Währungen plus EIN EXOTISCHES Paar oder Rohstoffe oder Indexe! Jedes Produkt kann als 9. Linie hinzugefügt werden. Fügen Sie Rohstoffe, Indexes oder exotische Währungen hinzu (Gold, Silber, Öl, DAX, US30, MXN, TRY, CNH ...). Eine neue noch nie dagewesene TRADING STRATEGIE  !!! Dieser Indikator ist einzigartig, weil wir eine Reihe von proprietäre Funktionen und neue Formeln eingebaut haben. Es funktioniert für alle Zeitrahmen. Basierend auf neuen zugrunde liegenden Algorithmen ist e
Derzeit 20% Rabatt! Die beste Lösung für jeden Neueinsteiger oder Expert Händler! Dieses Dashboard arbeitet mit 28 Währungspaaren. Es basiert auf 2 unserer Hauptindikatoren (Advanced Currency Strength 28 und Advanced Currency Impulse). Es bietet einen hervorragenden Überblick über den gesamten Forex-Markt. Es zeigt die Werte der Advanced Currency Strength, die Veränderungsrate der Währungen und die Signale für 28 Devisenpaare in allen (9) Zeitrahmen. Stellen Sie sich vor, wie sich Ihr Handel
GOLD Impulse with Alert
Bernhard Schweigert
4.6 (10)
Dieser Indikator ist eine hervorragende Kombination aus unseren 2 Produkten Advanced Currency IMPULSE with ALERT  +   Currency Strength Exotics . Es funktioniert für alle Zeitrahmen und zeigt grafisch Impulse der Stärke oder Schwäche für die 8 wichtigsten Währungen plus ein Symbol! Dieser Indikator ist darauf spezialisiert, die Beschleunigung der Währungsstärke für beliebige Symbole wie Gold, Exotische Paare, Rohstoffe, Indizes oder Futures anzuzeigen. Als erster seiner Art kann jedes Symbol
FX Power MT4 NG
Daniel Stein
4.94 (18)
FX Power: Analysieren Sie die Stärke von Währungen für intelligentere Handelsentscheidungen Übersicht FX Power ist Ihr unverzichtbares Werkzeug, um die tatsächliche Stärke von Währungen und Gold unter allen Marktbedingungen zu verstehen. Indem Sie starke Währungen kaufen und schwache verkaufen, vereinfacht FX Power Ihre Handelsentscheidungen und deckt Chancen mit hoher Wahrscheinlichkeit auf. Ob Sie Trends folgen oder extreme Delta-Werte nutzen, um Umkehrungen zu prognostizieren, dieses Tool p
Trend Arrow Super
Aleksandr Makarov
5 (2)
Special offer! https://www.mql5.com/ru/users/bossik2810 Trend Arrow Super The indicator not repaint or change its data. A professional, yet very easy to use Forex system. The indicator gives accurate BUY\SELL signals. Trend Arrow Super is very easy to use, you just need to attach it to the chart and follow simple trading recommendations. Buy signal: Arrow + Histogram in green color, enter immediately on the market to buy. Sell signal: Arrow + Histogram of red color, enter immediately on the m
StalkeR Arrow
Abdulkarim Karazon
5 (3)
StalkeR Arrow ist ein Pfeilindikator, der Kauf- und Verkaufssignale beim Öffnen/Intra-Bar des Balkens gibt. Dieser Indikator basiert auf Preisaktionsmustern und Fraktalen Dieser Indikator gibt tp und sl für jedes Kauf- und Verkaufssignal an. tp und sl liegen in Form von Linien über und unter jedem Signal vor und verlängern sich, bis ein neues Signal gebildet wird Dieser Indikator verfügt über ein Backtesting-Panel/Dashboard, das Gewinn-/Verluststatistiken von Verlaufssignalen liefert. Dieser In
Easy Breakout
Mohamed Hassan
5 (12)
After your purchase, feel free to contact me for more details on how to receive a bonus indicator called VFI, which pairs perfectly with Easy Breakout for enhanced confluence!   Easy Breakout is a powerful price action trading system built on one of the most popular and widely trusted strategies among traders: the Breakout strategy ! This indicator delivers crystal-clear Buy and Sell signals based on breakouts from key support and resistance zones. Unlike typical breakout indicators, it levera
Golden Trend Indicator
Noha Mohamed Fathy Younes Badr
5 (10)
Golden Trend indicator  is The best indicator for predicting trend movement this indicator never lags and never repaints and never back paints    and give  arrow buy and sell    before the candle appear  and it will help you and  will make your trading decisions clearer its work on all currencies and  gold and crypto and all time frame This unique  indicator uses very secret algorithms to catch the  trends, so you can trade using this indicator and see the trend clear on charts  manual guide and
Dynamic Forex28 Navigator
Bernhard Schweigert
5 (5)
Dynamic Forex28 Navigator – Das Forex-Handelstool der nächsten Generation AKTUELL 49 % RABATT. Dynamic Forex28 Navigator ist die Weiterentwicklung unserer seit langem beliebten Indikatoren und vereint die Leistung von drei in einem: Advanced Currency Strength28 Indicator (695 Bewertungen) + Advanced Currency IMPULSE mit ALERT (520 Bewertungen) + CS28 Combo Signals (Bonus) Details zum Indikator https://www.mql5.com/en/blogs/post/758844 Was bietet der Strength Indicator der nächsten Generation?
Currency Strength Wizard ist ein sehr leistungsstarker Indikator, der Ihnen eine Komplettlösung für erfolgreichen Handel bietet. Der Indikator berechnet die Stärke dieses oder jenes Forex-Paares anhand der Daten aller Währungen in mehreren Zeitrahmen. Diese Daten werden in Form von benutzerfreundlichen Währungsindizes und Währungsstärkelinien dargestellt, anhand derer Sie die Stärke dieser oder jener Währung erkennen können. Sie müssen lediglich den Indikator an das Diagramm anhängen, mit dem Si
TrendMaestro
Stefano Frisetti
4 (4)
note: this indicator is for METATRADER4, if you want the version for METATRADER5 this is the link:  https://www.mql5.com/it/market/product/108106 TRENDMAESTRO ver 2.4 TRENDMAESTRO recognizes a new TREND in the bud, he never makes mistakes. The certainty of identifying a new TREND is priceless. DESCRIPTION TRENDMAESTRO identifies a new TREND in the bud, this indicator examines the volatility, volumes and momentum to identify the moment in which there is an explosion of one or more of these data a
TPSproTREND PrO
Roman Podpora
4.68 (25)
VERSION MT5        —        ИНСТРУКЦИЯ RUS           —        INSTRUCTIONS  ENG Hauptfunktionen: Präzise Eingangssignale OHNE RENDERING! Wenn ein Signal erscheint, bleibt es relevant! Dies ist ein wichtiger Unterschied zu Redraw-Indikatoren, die ein Signal liefern und es dann ändern können, was zu einem Verlust des eingezahlten Geldes führen kann. Jetzt können Sie mit größerer Wahrscheinlichkeit und Genauigkeit in den Markt eintreten. Es gibt auch eine Funktion zum Einfärben der Kerzen nach de
TPSpro RFI Levels
Roman Podpora
4.85 (27)
Umkehrzonen / Spitzenvolumina / Aktive Zonen eines Hauptakteurs =       TS TPSPROSYSTEM ANLEITUNG RUS       /       ANWEISUNGEN       ENG              /          Version MT5 Jeder Käufer dieses Indikators erhält zusätzlich KOSTENLOS: 6 Monate Zugriff auf Handelssignale vom Dienst RFI SIGNALS – vorgefertigte Einstiegspunkte gemäß dem TPSproSYSTEM-Algorithmus. Schulungsmaterialien mit regelmäßigen Updates – tauchen Sie in die Strategie ein und steigern Sie Ihr berufliches Niveau. 24/5-Support an
Stratos Pali
Michela Russo
5 (3)
Stratos Pali Indicator   is a revolutionary tool designed to enhance your trading strategy by accurately identifying market trends. This sophisticated indicator uses a unique algorithm to generate a complete histogram, which records when the trend is Long or Short. When a trend reversal occurs, an arrow appears, indicating the new direction of the trend. Important Information Revealed Leave a review and contact me via mql5 message to receive My Top 5 set files for Stratos Pali at no cost! Dow
Scalper Vault
Oleg Rodin
5 (30)
Scalper Vault ist ein professionelles Scalping-System, das Ihnen alles bietet, was Sie für erfolgreiches Scalping benötigen. Dieser Indikator ist ein komplettes Handelssystem, das von Forex- und Binäroptionshändlern verwendet werden kann. Der empfohlene Zeitrahmen ist M5. Das System liefert Ihnen genaue Pfeilsignale in Richtung des Trends. Es liefert Ihnen auch Top- und Bottom-Signale und Gann-Marktniveaus. Die Indikatoren bieten alle Arten von Warnungen, einschließlich PUSH-Benachrichtigungen.
Hit Rate Top Bottom Signal
Martin Alejandro Bamonte
Hit Rate Top Bottom Signal Hit Rate Top Bottom Signal Hit Rate Top Bottom Signal bietet einen völlig innovativen Ansatz. Es ist ideal für diejenigen, die im Voraus bewerten möchten, wie das Signal mit einem bestimmten TP-SL funktioniert und in welchen PAAREN/TFs es am besten abschneidet. Die Strategie Hit Rate Top Bottom Signal ist ein grundlegendes Werkzeug für jeden Trader und jede Art von Handel , denn sie gibt nicht nur präzise, nicht-neuzeichnende Signale ab, die klar anzeigen, wann und in
Wir stellen vor       Quantum Trend Sniper Indicator   , der bahnbrechende MQL5-Indikator, der die Art und Weise, wie Sie Trendumkehrungen erkennen und handeln, verändert! Entwickelt von einem Team erfahrener Händler mit über 13 Jahren Handelserfahrung,       Quantum Trend Sniper-Indikator       wurde entwickelt, um Ihre Trading-Reise mit seiner innovativen Methode zur Identifizierung von Trendumkehrungen mit extrem hoher Genauigkeit auf ein neues Niveau zu heben. ***Kaufe Quantum Trend Sniper
IQ FX Gann Levels a precision trading indicator based on W.D. Gann’s square root methods. It plots real-time, non-repainting support and resistance levels to help traders confidently spot intraday and scalping opportunities with high accuracy. William Delbert Gann (W.D. Gann) was an exceptional market analyst, whose trading technique was based on a complex blend of mathematics, geometry, astrology, and ancient mathematics which proved to be extremely accurate. Download the Metatrader 5 Version M
Probieren Sie "Chart Patterns All in One" im Demo-Modus aus und erhalten Sie einen Bonus. Senden Sie mir eine Nachricht, nachdem Sie es im Demo-Modus getestet haben, um Ihren Bonus zu erhalten. Hinterlassen Sie nach dem Kauf einen Kommentar, um 8 hochwertige Indikatoren als Bonus zu erhalten. Der Chart Patterns All-in-One Indikator hilft Tradern, verschiedene Chartmuster, die häufig in der technischen Analyse verwendet werden, zu visualisieren. Dieser Indikator unterstützt die Identifizierung m
- Real price is 80$ - 40% Discount (It is 49$ now) - Lifetime update free Contact me for instruction, add group and any questions! Related Products:  Bitcoin Expert , Gold Expert - Non-repaint - I just sell my products in Elif Kaya profile, any other websites are stolen old versions, So no any new updates or support. Introduction The breakout and retest strategy is traded support and resistance levels. it involves price breaking through a previous level.  The break and retest strategy is design
Weitere Produkte dieses Autors
Wenn Sie Forex handeln, kann detailliertes Wissen über die Währungsstärke und die Korrelation zwischen Währungspaaren Ihr Trading auf ein neues Niveau heben. Die Korrelation hilft, Ihr Risiko zu halbieren, während die Stärkenanalyse Ihre Gewinne maximieren kann. Dieser Indikator bietet einen hybriden Ansatz zur Auswahl der besten Währungspaare, basierend auf einer Kombination aus Stärkenanalyse und Korrelation. Wie man die Währungsstärkenanalyse verwendet Angenommen, Ihre Handelsstrategie biete
KT Asian Breakout Indicator
KEENBASE SOFTWARE SOLUTIONS
Der KT Asian Breakout Indikator analysiert einen wichtigen Teil der asiatischen Handelssitzung, um in beide Richtungen Kauf- und Verkaufssignale basierend auf dem Preis-Ausbruch zu generieren. Ein Kaufsignal wird ausgelöst, wenn der Preis das Sitzungs-Hoch durchbricht, und ein Verkaufssignal tritt auf, wenn der Preis das Sitzungs-Tief durchbricht. Wichtige Hinweise Wenn die Sitzungsbox vertikal zu breit ist, sollte ein neuer Trade vermieden werden, da die meisten Kursbewegungen bereits innerhal
KT Auto Fibo
KEENBASE SOFTWARE SOLUTIONS
KT Auto Fibo zeichnet Fibonacci-Retracement-Level basierend auf der aktuellen Trendrichtung automatisch ein. Die Hoch- und Tiefpunkte werden automatisch anhand der verfügbaren Maximal- und Minimalwerte auf dem Chart ausgewählt. Sie können hinein- und herauszoomen sowie scrollen, um die Fibonacci-Level entsprechend anzupassen. Modi Automatisch:  Zeichnet die Fibonacci-Level automatisch basierend auf dem sichtbaren Chartbereich. Manuell: Zeichnet die Fibonacci-Level einmalig. Danach können die An
KT Psar Arrows
KEENBASE SOFTWARE SOLUTIONS
KT Psar Arrows platziert Pfeile auf dem Chart unter Verwendung des Standardindikators Parabolic SAR. Ein bullischer Pfeil wird gezeichnet, wenn das Hoch der Kerze den SAR berührt. Ein bärischer Pfeil wird gezeichnet, wenn das Tief der Kerze den SAR berührt. Die Signale werden in Echtzeit generiert, ohne auf den Kerzenschluss zu warten.  Funktionen Ein hilfreiches Tool für Trader, die Strategien testen möchten, die den Parabolic SAR-Indikator verwenden.  Kann genutzt werden, um Wendepunkte im Ma
KT Volatility Oscillator
KEENBASE SOFTWARE SOLUTIONS
Der KT Volatilitätsoszillator analysiert vergangene und aktuelle Marktdaten mithilfe einer mathematischen Formel und stellt das Ergebnis in Form eines Oszillators dar. Wachsende und abnehmende Wellen entsprechen einer hohen beziehungsweise niedrigen Volatilität des Vermögenswerts.  Kurz gesagt, Volatilität ist ein Maß für die Preisänderungen eines Vermögenswerts über einen bestimmten Zeitraum. Ohne Volatilität gäbe es kaum Bewegungen am Markt und Trader könnten nicht von den Kursbewegungen profi
KT MA Crossover MT5
KEENBASE SOFTWARE SOLUTIONS
KT MA Crossover zeigt Kauf- und Verkaufspfeile basierend auf dem Schnittpunkt der ausgewählten gleitenden Durchschnitte an. Darüber hinaus erzeugt es entsprechende Warnmeldungen und zeigt den MFE-Wert (Most Favorable Excursion) für jedes aufeinanderfolgende Signal an. Das Crossover von gleitenden Durchschnitten ist eine der am häufigsten verwendeten Strategien unter Tradern weltweit. In der Regel besteht sie aus einem schnellen und einem langsamen gleitenden Durchschnitt, um Kauf- und Verkaufss
KT Momentum Arrows MT5
KEENBASE SOFTWARE SOLUTIONS
5 (2)
Der KT Momentum Arrows Indikator basiert auf einem kurzfristigen Ausbruch, der durch Bandabweichungen und entstehende Volatilität in eine bestimmte Richtung berechnet wird. Ein Kaufsignal wird generiert, wenn der Schlusskurs über dem oberen Band liegt, und ein Verkaufssignal, wenn der Schlusskurs unter dem unteren Band liegt. Ein Magnituden-Koeffizient wird als Eingabewert verwendet und beeinflusst sowohl die Bandabweichung als auch die Volatilität. Der Wert sollte sorgfältig in Bezug auf das In
KT RSI Divergence Robot MT4
KEENBASE SOFTWARE SOLUTIONS
KT RSI Divergence robot is a 100% automated expert advisor that trades regular and hidden divergence built between the price and Relative Strength Index (RSI) oscillator. The divergence signals are fetched from our freely available RSI divergence indicator. Not every divergence ends up in a successful price reversal, that's why this ea combines the raw divergences signals with its inbuilt technical analysis module to exploit the price inefficiency that occurs after some selected divergence sig
KT RSI Divergence Robot MT5
KEENBASE SOFTWARE SOLUTIONS
KT RSI Divergence robot is a 100% automated expert advisor that trades regular and hidden divergence built between the price and Relative Strength Index (RSI) oscillator. The divergence signals are fetched from our freely available RSI divergence indicator. Not every divergence ends up in a successful price reversal, that's why this ea combines the raw divergences signals with its inbuilt technical analysis module to exploit the price inefficiency that occurs after some selected divergence sig
Use of support and resistance in systematic trading is very subjective. Every trader has their own idea and way to plotting the support and resistance levels on the chart. KT Support and Resistance indicator take out this ambiguity out of the situation and automatically draws support and resistance levels following an algorithmic approach using a unique multi-timeframe analysis. When launched on the chart, It immediately scan the most significant extreme points across all the available timefra
KT Stoch Divergence MT5
KEENBASE SOFTWARE SOLUTIONS
Divergenzen gehören zu den wichtigsten Signalen zur Vorhersage möglicher Kursumkehrungen. KT Stoch Divergence zeigt reguläre und versteckte Divergenzen zwischen dem Kurs und dem Stochastic-Oszillator. Einschränkungen von KT Stoch Divergence Die alleinige Nutzung von Stochastic-Divergenzen als Einstiegssignal kann riskant sein. Nicht jede Divergenz weist auf eine starke Trendumkehr hin. Für bessere Ergebnisse sollte sie mit der Preisaktion und dem Trend kombiniert werden. Funktionen Markiert r
KT Trend Magic MT5
KEENBASE SOFTWARE SOLUTIONS
KT Trend Magic shows the trend depiction on chart using the combination of market momentum and volatility. A smoothing coefficient is used to smooth out the noise from the signal.It can be used to find out the new entries or confirm the trades produced by other EA or indicator. Features Drag n drop MTF scanner which scans for the new signals across multiple time-frames. Find new entries in the trend direction. Improve the accuracy of other indicators when used in conjunction. Can be used as a d
KT Trend Magic
KEENBASE SOFTWARE SOLUTIONS
KT Trend Magic shows the trend depiction on chart using the combination of market momentum and volatility. A smoothing coefficient is used to smooth out the noise from the signal.It can be used to find out the new entries or confirm the trades produced by other EA/Indicators. Usage Drag n drop MTF scanner which scans for the new signals across multiple time-frames. Find new entries in the trend direction. Improve the accuracy of other indicators when used in conjunction. Can be used as a dynami
KT COG Advanced MT4
KEENBASE SOFTWARE SOLUTIONS
1 (1)
KT COG is an advanced implementation of the center of gravity indicator presented by John F. Ehlers in the May 2002 edition of Technical Analysis of Stocks & Commodities magazine. It's a leading indicator which can be used to identify the potential reversal points with the minimum lag. The COG oscillator catches the price swings quite effectively. MT5 version of the same indicator is available here KT COG Advanced MT5 Calculation of COG The COG indicator is consist of the two lines. The main l
KT CCI Divergence MT4
KEENBASE SOFTWARE SOLUTIONS
KT CCI Divergence shows the regular and hidden divergence created between the price and CCI oscillator. Divergence is one of the vital signals that depicts the upcoming price reversal in the market. Manually spotting the divergence between price and CCI can be a hectic and ambiguous task. Limitations of KT CCI Divergence   Using the CCI divergence as a standalone entry signal can be risky. Every divergence can't be interpreted as a strong reversal signal. For better results, try to combine it w
ACB Breakout Arrows
KEENBASE SOFTWARE SOLUTIONS
4.15 (34)
The ACB Breakout Arrows indicator provides a crucial entry signal in the market by detecting a special breakout pattern. The indicator constantly scans the chart for a settling momentum in one direction and provide the accurate entry signal right before the major move.  Get multi-symbol and multi-timeframe scanner from here - Scanner for ACB Breakout Arrows MT4 Key features Stoploss and Take Profit levels are provided by the indicator. Comes with a MTF Scanner dashboard which tracks the breako
ACB Trade Filter MT4
KEENBASE SOFTWARE SOLUTIONS
5 (1)
The ACB Trade Filter indicator provides a solution for filtering out the low probability trading setups in a trading strategy. The indicator uses a sophisticated filtration algorithm based on the market sentiment and trend. Applications Works great with our indicator " ACB Breakout Arrows ". Filter out low probability signals from any indicator. Avoid overtrading and minimize the losses. Trade in the direction of market sentiment and trend. Avoid the choppiness in the market. How to use Only L
KT Momentum Arrows
KEENBASE SOFTWARE SOLUTIONS
Der KT Momentum Arrows Indikator basiert auf einem kurzfristigen Ausbruch, der durch Bandabweichungen und entstehende Volatilität in eine bestimmte Richtung berechnet wird. Ein Kaufsignal wird generiert, wenn der Schlusskurs über dem oberen Band liegt, und ein Verkaufssignal, wenn der Schlusskurs unter dem unteren Band liegt. Ein Magnituden-Koeffizient wird als Eingabewert verwendet und beeinflusst sowohl die Bandabweichung als auch die Volatilität. Der Wert sollte sorgfältig in Bezug auf das In
KT Pin Bar
KEENBASE SOFTWARE SOLUTIONS
KT Pin Bar identifies the pin bar formation which is a type of price action pattern which depicts a sign of reversal or rejection of the trend. When combined with support and resistance, BRN and other significant levels, Pin Bar pattern proved to be a very strong sign of reversal. Basically, a pin bar is characterized by a small body relative to the bar length which is closed either in upper or lower 50% part of its length. They have very large wicks and small candle body. A pin bar candlestic
KT Ichimoku Trader
KEENBASE SOFTWARE SOLUTIONS
1 (1)
KT Ichimoku Trader is a fully automated expert advisor that offers five popular trading strategies based on the Ichimoku indicator. Each strategy has it's own entry and exit method without any interference to other strategies. The Ichimoku system can be applied to all major currency pairs and metals. However, we found that it performs reasonably well mainly on two pairs.   MT5 Version is available here  https://www.mql5.com/en/market/product/35043 Features Trade up to 5 famous trading strategi
KT COG Robot
KEENBASE SOFTWARE SOLUTIONS
KT COG Robot is a fully automated Expert Advisor based on the KT COG Indicator . The COG indicator was originally presented by John F. Ehlers in the May 2002 edition of Technical Analysis of Stocks & Commodities magazine. The EA fires a long trade when COG line cross above the signal line and a short trade is fired when the COG line cross below the signal line.  Adaptive Filtration Our adaptive filtration algorithm combines the original COG formula with the major trend direction and market acce
ACB Breakout Arrows EA
KEENBASE SOFTWARE SOLUTIONS
This is a 100% automated expert advisor based on our custom indicator named "ACB Breakout Arrows" . The entries are based on a breakout pattern that constantly occurs in a bi-directional manner. The intensity of entry signals can be manipulated using the external input called "Signal Sensitivity". MT5 Version is available here  https://www.mql5.com/en/market/product/35785 Trades Confirmation ACB Breakout Arrows EA provides an ability to filter the entries using our another custom indicator nam
KT Asian Breakout
KEENBASE SOFTWARE SOLUTIONS
4 (1)
KT Asian Breakout carefully analyzes the range-bound market during the Asian session and then fires a long or short trade after doing some preassessment based on its inbuilt technical analysis module. The executed orders are closed within a day before the completion of the next day session. The inbuilt technical analysis module checks for the session range and compares it with the last 20 days price movement. If it finds any erratic price movement within the session, the orders are not executed
KT London Breakout
KEENBASE SOFTWARE SOLUTIONS
First thirty minutes are essential for a trading session. The early reaction of traders and market players sets a path for the rest of the day. KT London Breakout EA takes advantage of this phenomenon, and after analyzing the first thirty minutes of London session, it places two bidirectional pending orders. One of pending order is eventually canceled after realizing the market direction with certainty. It has been strictly tested and developed for EUR/JPY using 30-Min Time Frame. You can expe
MACD Divergence Seeker
KEENBASE SOFTWARE SOLUTIONS
KT MACD Divergence Seeker trades the regular and hidden divergence signals generated by our free indicator named KT MACD Divergence indicator. Trading the standalone divergences can be a risky affair that's why the KT MACD Divergence Seeker combines the standard divergence signals with an advanced analysis module to exploit the price inefficiencies on some FX pairs. What is the Divergence exactly? As a general conception if the price is making higher highs, then macd should also be making hig
MACD Divergence MT4
KEENBASE SOFTWARE SOLUTIONS
KT MACD Divergence shows the regular and hidden divergences build between the price and oscillator. If your trading strategy anticipates the trend reversal, you can include the MACD regular divergence to speculate the potential turning points. And if your trading strategy based on the trend continuation, MACD hidden divergence would be a good fit. Limitations of KT MACD Divergence Using the macd divergence as a standalone entry signal can be a risky affair. Every divergence can't be interprete
KT Bollinger Bands Trader MT4
KEENBASE SOFTWARE SOLUTIONS
KT Bollinger Bands Trader is a 100% automated expert advisor that's incorporated a mean reversion trading strategy using the Bollinger bands during the period of low volatility. Price often reacts at the upper or lower line of Bollinger bands, but a reversal not always occurs. However, there is more chance of price reversal during the time of low volatility. Entries A buy trade is activated when price correctly aligns below the bottom line of Bollinger bands. A sell trade is activated when pric
KT Heiken Ashi Smoothed MT4
KEENBASE SOFTWARE SOLUTIONS
KT Heiken Ashi Smoothed is a smoothed version of the standard Heiken Ashi. Moreover, it also plots buy/sell arrows on a trend change. A buy arrow is plotted when it change to a bullish state from bearish state. A sell arrow is plotted when it change to a bearish state from bullish state. Mobile notifications, Email, Sound and Pop-up alerts included. What exactly is Heiken Ashi Smoothed? It filters out the false signals and noise in the standard Heiken Ashi. It applies the set of two moving ave
KT MA Crossover MT4
KEENBASE SOFTWARE SOLUTIONS
KT MA Crossover zeigt Kauf- und Verkaufspfeile basierend auf dem Schnittpunkt der ausgewählten gleitenden Durchschnitte an. Darüber hinaus erzeugt es entsprechende Warnmeldungen und zeigt den MFE-Wert (Most Favorable Excursion) für jedes aufeinanderfolgende Signal an. Das Crossover von gleitenden Durchschnitten ist eine der am häufigsten verwendeten Strategien unter Tradern weltweit. In der Regel besteht sie aus einem schnellen und einem langsamen gleitenden Durchschnitt, um Kauf- und Verkaufss
KT Round Numbers MT4
KEENBASE SOFTWARE SOLUTIONS
KT Round Numbers plots the round number levels which are also commonly known as psychological levels in the Forex world. In the context of Forex trading, round number levels are those levels in which there are two or more zeroes at the end. They are named as 00 levels on the chart. Some traders also consider the halfway points as a valid round number level. They are named as 50 levels on the chart. Use of round number levels in trading Round number levels work as strong support and resistance
Auswahl:
Daniel Molina Olmedo
198
Daniel Molina Olmedo 2025.04.22 17:58 
 

One of the best trend indicators. I really appreciate your work with this easy-to-use indicator. Thank you so much for this wonderful indicator and especially for your kind support. Best regards.

KEENBASE SOFTWARE SOLUTIONS
50498
Antwort vom Entwickler Nitin Raj 2025.04.22 19:44
Thank you for your valuable feedback.
Antwort auf eine Rezension