• Übersicht
  • Bewertungen
  • Diskussion

AIS Kolmogorov Zhurbenko Filter

Das Kolmogorov-Zhurbenko-Filter kann als eine spezielle Fensterfunktion angesehen werden, die zum Eliminieren von spektralem Auslaufen ausgelegt ist. Dieser Filter ist optimal zum Glätten stochastischer (einschließlich finanzieller) Zeitreihen.
Der auf diesem Filter basierende Indikator enthält die folgenden Parameter:
  • iLength – die Periode des ursprünglichen rechteckigen Fensters, das zum Erstellen des Filters verwendet wurde. Der gültige Wert ist 2 - 255.
  • iDegree - Filterreihenfolge. Wenn iDegree=0, dann wird ein einfacher gleitender Durchschnitt erhalten. Wenn iDegree=1, erhalten Sie einen dreieckigen gleitenden Durchschnitt. Höhere Ordnungen ermöglichen eine bessere Glättung und Rauschunterdrückung. Zulässiger Wert ist 2 - 255. Dieser Parameter beeinflusst auch die letzte Periode des Indikators = iLength + iDegree * (iLength - 1).
  • iMultiplier – ein Multiplikator, der die Anzahl der vom Filterwert gezählten Standardabweichungen anzeigt.

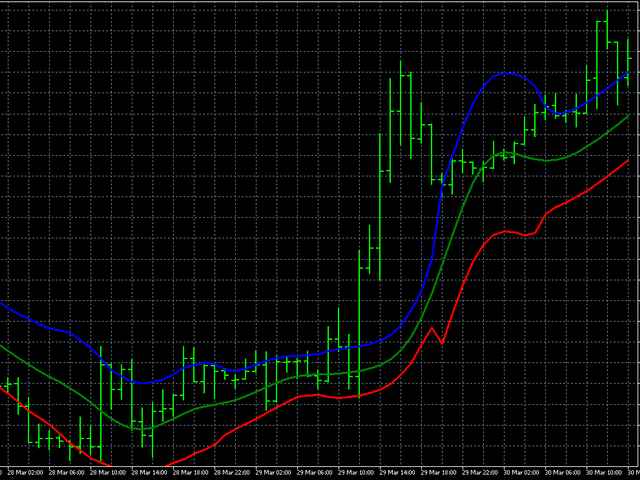
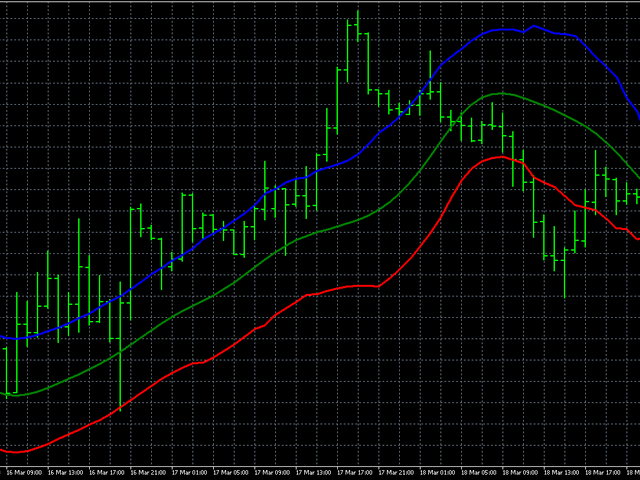
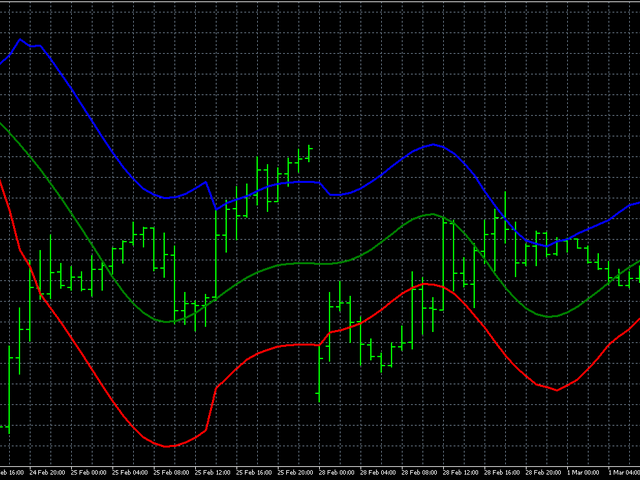
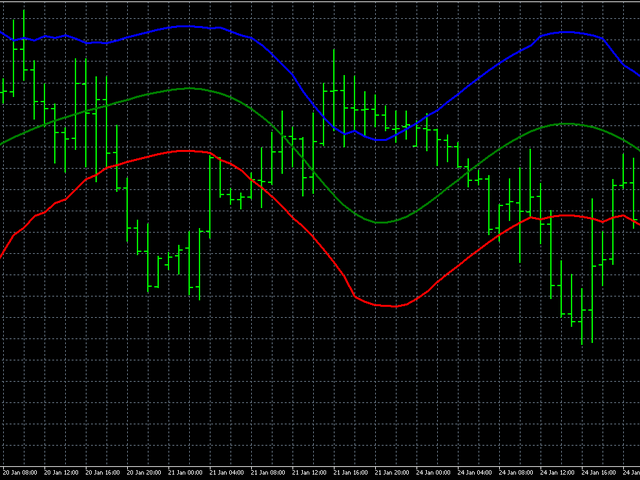
Das Aussehen des Indikators ist in den Bildern dargestellt.
Empfohlene Produkte
Bei diesem Indikator handelt es sich um einen Indikator für die automatische Wellenanalyse, der sich perfekt für den praktischen Handel eignet! Fall... Hinweis:   Ich bin es nicht gewohnt, westliche Namen für die Welleneinstufung zu verwenden. Aufgrund des Einflusses der Namenskonvention von Tang Lun (Tang Zhong Shuo Zen) habe ich die Grundwelle als   Stift   und das sekundäre Wellenband als   Segment   bezeichnet Gleichzeitig hat das Segment die   Trendrichtung   benannt (diese Benennungsmeth
No Repaint Bext ist ein vollständiges Handelssystem. Es zeigt an, wann eine Position geöffnet oder geschlossen werden soll und in welche Richtung gehandelt werden muss. Jedes Mal, wenn ein grüner Pfeil erscheint, sollte eine Kaufposition eröffnet werden. Alle Kaufpositionen werden geschlossen, sobald ein roter Pfeil erscheint. Umgekehrt wird bei einem roten Pfeil eine Verkaufsposition eröffnet, die geschlossen wird, sobald ein grüner Pfeil erscheint. Der Handel erfolgt auf dem M5-Zeitrahmen und
Valentines
Victor Golovkov
Valentines trend is an easy-to-use indicator that hides a powerful calculation math-system "under the hood". Attach the indicator to the chart and set the parameters. Period - period for tracking changes in quotes Amount of Bars - number of last bars to track You do not need to select any numerical parameters. The indicator will do everything for you automatically . Each signal is generated on the current bar, and in order not to miss it, use the built-in alerts and notifications system . The in
Note : The slow loading of the indicator issue has been addressed . This new version loads fast and does not slow the platform. Version 1.3 : We have updated the indicator to include an historical bar scanning option . So instead of scanning all bars in the history (which can make the indicator slow sometimes ) , you can select the maximum number of bars it can scan which can increase the performance and make the indicator faster. This indicator scans the 1-3 Trendline pattern . The indicato
Drawing Pack
John Louis Fernando Diamante
4 (1)
This indicator provides several drawing tools to assist in various methods of chart analysis. The drawings will keep their proportions (according to their handle trendline) across different chart scales, update in real time, and multiple drawings are supported. # Drawing Option Description  1 Grid box draggable boxed grid, user defines rows x colums, diagonal ray option  2 Grid partial or fullscreen grid, sized by handle line  3 Grid flex a diagonal grid, sized and sloped by handle line  4 Cyc
The trader uses the Trend for Neuro indicator to determine the market situation. This is a trending algorithm that is convenient to download, install and use. The algorithm with acceptable accuracy generates input signals and output levels. Strategy for trend trading, filtering and all the necessary functions built into one tool! By launching the indicator, the user will see only two types of arrows that can change color to blue during an uptrend, to red during a downtrend there is no uncertaint
Moving Pivot Average    The pivot indicator compares the selected period with its counterpart from the previous period. The indicator uses very flexible algorithm for pivot value calculating. It allows you to allocate in days a certain time intervals (custom bars) and calculate the average pivot value based on High, Low and Close prices of these bars. How many custom bars will be taken into account is determined by the "Days" setting. The pivot line can be considered an average trend line and us
Smart trends view
Maria Cristina Sabatini
Clear trend filter   This is a filter-trend indicator.  From the settings you can select to use more filter or less. The very interesting part of the indicator comes out using with all the filter. In this way you can follow the trend easily even when the market is without a strong trend, but is instead more flat. I personally use it on 1 minutue timeframe with  MORE FILTER (you can select it from the input setting) in order to have an overlook of trend in the market.   Added: - Sound Notificatio
To get access to MT5 version please click here . You can also check the other popular version of this indicator   here . This is the exact conversion from TradingView:"HIGH AND LOW Optimized Trend TrackerHL OTT" by "kivancozbilgic" The screenshot shows similar results from tradingview and Metatrader when tested on ICMarkets on both platforms. This is a light-load processing indicator. It is a non-repaint indicator. Colored Candle and Highlighting options are not available. Buffers are available
Dynamic SR Trend Channel Dynamic SR Trend Channel is a simple indicator for trend detection as well as resistance/support levels on the current timeframe. It shows you areas where to expect possible change in trend direction and trend continuation. It works with any trading system (both price action and other trading system that use indicators) and is also very good for renko charting system as well. In an uptrend, the red line (main line) serves as the support and the blue line serves as the r
The product has been removed from sale。 Sales suspended, do not download. 2025/1/28 The product has been removed from sale。 Sales suspended, do not download. 2025/1/28 产品已下架  产品已下架 The product has been removed from sale。Sales suspended, do not download. 2025/1/28 The product has been removed from sale。Sales suspended, do not download. 2025/1/28 产品已下架 产品已下架 The product has been removed from sale 产品已下架 The product has been removed from sale 产品已下架  The product has been removed from sale The product
Fluctuation Bands
Francisco De A Vilar Enriquez
Shows the price fluctuation bands associated with a moving average. It is extremely accurate, and it's a wonderful visual guide. The indicator consists of 4 bands . The two bands closest to the price form the fluctuation channel , they mark the maximum calculated deviation of the price from the moving average. The outer bands mark the maximum overdeviation of the price with respect to the fluctuation channel, they are overbought or oversold areas. Features.  -The change of periods of the MA is d
Reincarnations
Maryna Shulzhenko
The Reincarnations trend indicator is used to determine the strength and direction of a trend and to find price reversal points. This tool scans the market looking for the correct entry. You can see and evaluate it yourself, perhaps it will suit you for a number of tasks related to forecasting price movements. It uses only price data and analytics to calculate entry points. Does not use auxiliary indicators. It has two parameters for customization. Indicator setting. Interval - price analysis
ROC acceleration-deceleration is the manual system for medium-term scalping. Indicator based on custom ROC system which defines bullish/bearish market and especially  acceleration-deceleration of tendention in the market's main direction. Buy arrow is plotted during bearish market when current trend decelerates and sell  arrow is plotted during bullish market when current trend decelerates. Main Indicator's Features Signals are not repaint,non-late or disappear(exept cases when system recalculat
This product works by detecting trend opportunities. So as shown in the screenshot when The indicator shows an upward arrow it shows the market is on an uptrend and when the indicator Shows a downward arrow it shows the market is on a downward direction. What makes this indicator Special is that it has additional signals just below the arrow signals. It is up to the trader to be  Creative and combine these signals with the arrow signal to get accurate forecasts.
REMINDER: Early buyers hot price discount: Price subject to rise after first 20 copies. Starting price $65 and final price will be $1275. Secure your discounted copy Now! Smart Money Analyser Indicator User Manual 1. Introduction Welcome to the   Smart Money Analyser Indicator This powerful tool provides traders with comprehensive market analysis by combining various technical indicators to generate actionable trading signals. Designed to be user-friendly, this indicator helps traders of all
RSI Jurik
Augustine Kamatu
Introducing RSI Jurik—an innovative indicator designed to revolutionize your forex trading strategy by combining custom moving averages based on the Relative Strength Index (RSI) with the MetaTrader 4 indicator, RSI. Jurik moving averages are renowned for their accuracy and reliability in analyzing price movements in the forex market. They provide traders with smoother representations of price action, reducing noise and offering clearer signals for identifying trends and potential reversals.
FREE
PTW NON REPAINT TRADING SYSTEM + HISTOGRAM Non-Repainting ,   Non-Redrawing   and   Non-Lagging  Trading System. Does the following: - Gives Accurate Entry and Exit Points - Scalping, Day and Swing Trading  - 95% Accuracy  - Targets, where to take profits. - Shows Trends, Support and resistance levels - Works on All Brokers - Works on All Currencies, CFDs and Stocks - It does not place trades for you, it only shows you what trades to place. - It works on All Timeframes - It is for Trend or ran
KT DMA is a modified and advanced version of the classic Displaced Moving Averages with buy/sell crossover alerts and a Multi-Timeframe scanner that shows DMA's direction across each real-time time frame. A Displaced Moving Average is a simple moving average that moves ahead or backward in a time frame (either short-term or long-term). It also allows you to predict price movement more accurately. Features Depicts the trend direction using the alignment of three moving averages. Buy/Sell signals
To access the TD sequential Scanner for MT5, please check https://www.mql5.com/en/market/product/123369?source=Site +Market+My+Products+Page. One of the MT5 versions includes additional timeframes such as M1, M2, M3,H2,H6,H8 and so on.( https://www.mql5.com/en/market/product/123367?source=Site +Market+My+Products+Page) TD Sequential Scanner: An Overview The TD Sequential scanner is a powerful technical analysis tool designed to identify potential price exhaustion points and trend reversals in fi
This system never paints.   This system created by using Envolpes bands and reverse bar count.   This indicator is only working in M5 period.   This system is for long term and profitable.   Signals are shown as arrows. as an optional limit orders.   You can set a voice alarm or email notification.   You can fins our other products from link : https://www.mql5.com/en/users/drbastem/seller   Also, you can ask all your questins from email : haskayafx@gmail.com or mobile : +90 530 867 5076 or @Meh
This indicator shows in a subwindow the trend in M1, M5, H1, D1 timeframes based on MA, MACD, Stochastic This way you could see in once in different timeframes what happening.  This is my first free indicator. Please follow I will put here some more. Thank you for you attention.  . . . . . lfknglkslksnlgslgnsflgjrpoesv ,msv lkrjpfjésmdg sd.npo4wsmdglknsp4jwpkeégmfs.lkmp Thank you
FREE
The Waddah Attar Explosion (WAE) indicator is a potent tool in Forex trading, offering buy, sell, exit buy, and exit sell signals. It assesses trends as trend power and momentum as explosion power. Trend Direction: - Green bars indicate a bullish trend. - Red bars indicate a bearish trend. Signal Line: - A line serves as a threshold for momentum. Buy Trade Setup: **Entry:** Go long when a green bar crosses above the threshold. Place a stop loss below the entry candle. **Exit:** Close the tra
Eine Reihe von Indikatoren, die Wendepunkte erkennen. Erkennt Höchst- und Tiefststände von Candlestick-Kombinationen, nachdem sie von zwei MAs abgezogen wurden. Gilt für Handelssysteme bei Verwendung von Early Entrys. Kann entlang des Trends für Scalping und Intraday-Handel sowie zur frühzeitigen Erkennung von Trendumkehrungen verwendet werden. Möglichkeiten Die Parameter bieten flexible Einstellungen für beliebige Zeitrahmen und Handelsinstrumente. Es gibt verschiedene Arten von Alarmen für
TMoney OrderblockDay
Moises Orlando Urbina Sojo
The indicator is triggered at the start of each trading day and detects both bullish and bearish ORDERBLOCK potentials. These levels are of high operational probability, being able to use a minimum ratio of 3 to 1 to maximize profits. It is recommended to use TimeFrame M5 to M30 for a proper display and consider pending orders at the OB levels of the chart and place the SL up to a maximum of 20 pips from the entry price. Submit the indicator to Backtesting to become familiar with its performan
The indicator shows the Buy/Sell direction. The calculations use the opening prices and their rate of change for the billing period - "Calculation period" MTF indicator - "Calculation timeframe", no repaint - NRP. Two display types: "Chart default" или "Chart color" For "Chart color" color customization available : "Bar color" Two types stop levels: "Simple stop level" or "Dynamic stop level " Color settings: "Stop level color" Alerts available: "Chart message", "Push message", "Email message" F
A useful scanner/dashboard that shows the RSI values for multiple symbols and time-frames. It can be easily hidden/displayed with a simple click on the scanner man top left of the dashboard. You can input upper and lower RSI values and the colours can be set to show when above/below these values. The default values are 70 and 30. There are also input colours for when the RSI is above or below 50 (but not exceeding the upper/lower levels Symbols and time-frames are input separated by commas.
Implement
Vitalii Zakharuk
5 (1)
Implement analyzes market dynamics for pivot points. If you want to learn how to spot the correct reversals for consistently likely profitable trading, buy this indicator. Shows favorable moments of entering the market in stripes. Ready-made trading system. The principle of operation of the indicator is to automatically determine the current state of the market when placed on a chart, analyze historical data based on historical data and display instructions for further actions on the trader's
Linear Trend Predictor – Ein Trendindikator, der Einstiegspunkte und Richtungsunterstützungslinien kombiniert. Funktioniert nach dem Prinzip des Durchbrechens des Hoch-/Tiefpreiskanals. Der Indikatoralgorithmus filtert Marktrauschen und berücksichtigt Volatilität und Marktdynamik. Indikatorfunktionen  Mithilfe von Glättungsmethoden zeigt es den Markttrend und Einstiegspunkte zum Öffnen von Kauf- oder Verkaufsaufträgen an.  Geeignet zum Bestimmen kurzfristiger und langfristiger Marktbewegungen
Käufer dieses Produkts erwarben auch
Enigmera
Ivan Stefanov
5 (7)
ENIGMERA: Der Kern des Marktes Wichtig: Die MQL5.com-Demo wird im Strategy Tester ausgeführt und spiegelt möglicherweise nicht vollständig die Funktionalität von Enigmera wider. Überprüfen Sie die Beschreibung, Screenshots und das Video für Details. Zögern Sie nicht, mir bei Fragen eine Nachricht zu senden! Der Code des Indikators wurde vollständig neu geschrieben. Version 3.0 fügt neue Funktionen hinzu und behebt Fehler, die seit der Einführung des Indikators aufgetreten sind. Einführung Dies
Dynamic Forex28 Navigator
Bernhard Schweigert
5 (5)
Dynamic Forex28 Navigator – Das Forex-Handelstool der nächsten Generation AKTUELL 49 % RABATT. Dynamic Forex28 Navigator ist die Weiterentwicklung unserer seit langem beliebten Indikatoren und vereint die Leistung von drei in einem: Advanced Currency Strength28 Indicator (695 Bewertungen) + Advanced Currency IMPULSE mit ALERT (520 Bewertungen) + CS28 Combo Signals (Bonus) Details zum Indikator https://www.mql5.com/en/blogs/post/758844 Was bietet der Strength Indicator der nächsten Generation?
TPSproTREND PrO
Roman Podpora
4.68 (25)
VERSION MT5        —        ИНСТРУКЦИЯ RUS           —        INSTRUCTIONS  ENG Hauptfunktionen: Präzise Eingangssignale OHNE RENDERING! Wenn ein Signal erscheint, bleibt es relevant! Dies ist ein wichtiger Unterschied zu Redraw-Indikatoren, die ein Signal liefern und es dann ändern können, was zu einem Verlust des eingezahlten Geldes führen kann. Jetzt können Sie mit größerer Wahrscheinlichkeit und Genauigkeit in den Markt eintreten. Es gibt auch eine Funktion zum Einfärben der Kerzen nach de
Derzeit 20% Rabatt! Die beste Lösung für jeden Neueinsteiger oder Expert Händler! Dieses Dashboard arbeitet mit 28 Währungspaaren. Es basiert auf 2 unserer Hauptindikatoren (Advanced Currency Strength 28 und Advanced Currency Impulse). Es bietet einen hervorragenden Überblick über den gesamten Forex-Markt. Es zeigt die Werte der Advanced Currency Strength, die Veränderungsrate der Währungen und die Signale für 28 Devisenpaare in allen (9) Zeitrahmen. Stellen Sie sich vor, wie sich Ihr Handel
TPSpro RFI Levels
Roman Podpora
4.85 (27)
ANWEISUNGEN    Russland -    ENG    Die Empfehlung basiert auf dem Indikator -   TPSpro   TREND PRO -   Version MT5 Die wichtigsten Elemente in der Branche sind entweder in Zonen oder in der Fabrik enthalten, oder sie führen zu einer Lösung bei einem Kauf oder dem Verkauf eines anderen Instruments. Wenn viele Menschen ihre Rechte nicht auf dem Händlerkonto verschlüsseln, werden die Folgen nicht schnell genug sein. Ich habe es damit abgeschlossen, dass ich diese Folgen nun noch interpretieren un
Volatility Trend System – ein Handelssystem, das Signale für Einstiege gibt. Das Volatilitätssystem liefert lineare und punktuelle Signale in Richtung des Trends sowie Signale zum Verlassen des Trends, ohne Neuzeichnung und Verzögerungen. Der Trendindikator überwacht die Richtung des mittelfristigen Trends, zeigt die Richtung und deren Änderung an. Der Signalindikator basiert auf Änderungen der Volatilität und zeigt Markteintritte an. Der Indikator ist mit mehreren Arten von Warnungen ausgestat
Introduction to X3 Chart Pattern Scanner X3 Cherart Pattern Scanner is the non-repainting and non-lagging indicator detecting X3 chart patterns including Harmonic pattern, Elliott Wave pattern, X3 patterns, and Japanese Candlestick patterns. Historical patterns match with signal patterns. Hence, you can readily develop the solid trading strategy in your chart. More importantly, this superb pattern scanner can detect the optimal pattern of its kind. In addition, you can switch on and off individu
KT Renko Patterns MT4
KEENBASE SOFTWARE SOLUTIONS
2.33 (3)
KT Renko Patterns analysiert das Renko-Diagramm Stein für Stein, um bekannte Chartmuster zu finden, die häufig von Händlern an verschiedenen Finanzmärkten verwendet werden. Im Vergleich zu zeitbasierten Charts ist das Handeln mit Mustern auf Renko-Charts einfacher und deutlicher, da sie weniger überladen wirken. KT Renko Patterns enthält mehrere Renko-Muster, von denen viele ausführlich im Buch "Profitable Trading with Renko Charts" von Prashant Shah erklärt werden. Ein vollständig automatisie
Trend-Oszillator: Sanfte und Zuverlässige Marktrendenerkennung Der Trend-Oszillator ist ein fortschrittlicher Indikator für MT4, der Tradern dabei hilft, die Trendrichtung und potenzielle Umkehrpunkte präzise zu identifizieren. Mit einer intuitiven visuellen Darstellung zeigt dieser Indikator deutlich an, ob der Markt in einem Aufwärts- oder Abwärtstrend ist, vereinfacht die Analyse und verbessert die Lesbarkeit des Charts. Er ist für eine Vielzahl von Märkten und Zeitrahmen geeignet und bietet
Best Currency Strength Indicator
Tumelo Patrick Rakotsoane
4.5 (46)
Advanced Currency Strength Indicator The Advanced Divergence Currency Strength Indicator. Not only it breaks down all 28 forex currency pairs and calculates the strength of individual currencies across all timeframes , but, You'll be analyzing the WHOLE forex market in 1 window (In just 1 minute) . This indicator is very powerful because it reveals the true movements of the market.  It is highly recommended to  analyze charts knowing the performance of individual currencies or the countries eco
Wave Synchronizer – visueller Indikator der Wellenanalyse. Kombiniert Candlestick-Bewegungssequenzen und erzeugt gerichtete Wellenmuster, wodurch synchrone Bewegungen mit dem Markt entstehen. Der Beginn jeder Welle wird mit einem Signalpfeil angezeigt, außerdem gibt es Benachrichtigungen. Der Indikator wird die Pfeile im vergangenen Verlauf niemals neu zeichnen oder verschieben. Beim Schließen der Kerze erscheinen Signalpfeile. Passt sich an alle Handelsinstrumente und Zeitrahmen an. Einfach zu
Cycle Sniper
Elmira Memish
4.39 (36)
NEW YEAR SALE PRICE FOR LIMITED TIME!!! Please contact us after your purchase and we will send you the complimentary indicators to complete the system Cycle Sniper is not a holy grail but when you use it in a system which is explained in the videos, you will feel the difference. If you are not willing to focus on the charts designed with Cycle Sniper and other free tools we provide, we recommend not buying this indicator. We recommend watching the videos about the indiactor and system before pu
MTF Supply Demand Zones
Georgios Kalomoiropoulos
4.82 (22)
Automatisierte Angebots- und Nachfragezonen der nächsten Generation. Neuer und innovativer Algorithmus, der bei jedem Diagramm funktioniert. Alle Zonen werden dynamisch entsprechend der Preisbewegung des Marktes erstellt. ZWEI ARTEN VON WARNUNGEN --> 1) WENN DER PREIS EINE ZONE ERREICHT 2) WENN EINE NEUE ZONE BILDET WIRD Sie erhalten keinen weiteren nutzlosen Indikator. Sie erhalten eine vollständige Handelsstrategie mit nachgewiesenen Ergebnissen.     Neue Eigenschaften:     Warnungen, w
Currency Strength Exotics
Bernhard Schweigert
4.87 (31)
Stärke von 8 Währungen plus EIN EXOTISCHES Paar oder Rohstoffe oder Indexe! Jedes Produkt kann als 9. Linie hinzugefügt werden. Fügen Sie Rohstoffe, Indexes oder exotische Währungen hinzu (Gold, Silber, Öl, DAX, US30, MXN, TRY, CNH ...). Eine neue noch nie dagewesene TRADING STRATEGIE  !!! Dieser Indikator ist einzigartig, weil wir eine Reihe von proprietäre Funktionen und neue Formeln eingebaut haben. Es funktioniert für alle Zeitrahmen. Basierend auf neuen zugrunde liegenden Algorithmen ist e
Bonus: when you buy  the indicator, 2 any of my indicators for free (of your choice) .(Write in a private message or in telegram in the profile to receive a bonus) Quantum Entry is a powerful price action trading system built on one of the most popular and widely known strategies among traders: the Breakout Strategy! This indicator produces crystal clear buy and sell signals based on breakouts of key support and resistance zones. Unlike typical breakout indicators, it uses advanced calculation
Blahtech Supply Demand
Blahtech Limited
4.58 (36)
Was: $299  Now: $149   Supply Demand uses previous price action to identify potential imbalances between buyers and sellers. The key is to identify the better odds zones, not just the untouched ones. Blahtech Supply Demand indicator delivers functionality previously unavailable on any trading platform. This 4-in-1 indicator not only highlights the higher probability zones using a multi-criteria strength engine, but also combines it with multi-timeframe trend analysis, previously confirmed swings
GOLD Impulse with Alert
Bernhard Schweigert
4.6 (10)
Dieser Indikator ist eine hervorragende Kombination aus unseren 2 Produkten Advanced Currency IMPULSE with ALERT  +   Currency Strength Exotics . Es funktioniert für alle Zeitrahmen und zeigt grafisch Impulse der Stärke oder Schwäche für die 8 wichtigsten Währungen plus ein Symbol! Dieser Indikator ist darauf spezialisiert, die Beschleunigung der Währungsstärke für beliebige Symbole wie Gold, Exotische Paare, Rohstoffe, Indizes oder Futures anzuzeigen. Als erster seiner Art kann jedes Symbol
Volume by Price MT4
Brian Collard
4.67 (12)
Volume Profile, Footprint and Market Profile TPO (Time Price Opportunity). Volume and TPO histogram bar and line charts. Volume Footprint charts. TPO letter and block marker collapsed and split structure charts. Static, dynamic and flexible range segmentation and compositing methods with relative and absolute visualizations. Session hours filtering and segment concatenation with Market Watch and custom user specifications. Graphical layering, positioning and styling options to suit the user's a
System Trend Pro
Aleksandr Makarov
5 (2)
System Trend Pro - This is the best trend trading indicator!!! The indicator no repaint!!!  The indicator has   MTF   mode, which adds confidence to trading on the trend (   no repaint   ). How to trade? Everything is very simple, we wait for the first signal (big arrow), then wait for the second signal (small arrow) and enter the market in the direction of the arrow. (See screens 1 and 2.) Exit on the opposite signal or take 20-30 pips, close half of it, and keep the rest until the opposite s
MetaBands M4
Vahidreza Heidar Gholami
4 (4)
MetaBands verwendet leistungsstarke und einzigartige Algorithmen, um Kanäle zu zeichnen und Trends zu erkennen, sodass es Tradern potenzielle Punkte für den Einstieg und Ausstieg aus Trades bieten kann. Es ist ein Kanalindikator sowie ein leistungsstarker Trendindikator. Es umfasst verschiedene Arten von Kanälen, die einfach durch Verwendung der Eingabeparameter zusammengeführt werden können. MetaBands verwendet alle Arten von Warnmeldungen, um Benutzer über Marktereignisse zu informieren. Funkt
Beast Super Signal
Dustin Vlok
4.73 (89)
Suchen Sie nach einem leistungsstarken Indikator für den Devisenhandel, der Ihnen dabei helfen kann, profitable Handelsmöglichkeiten mit Leichtigkeit zu erkennen? Suchen Sie nicht weiter als das Beast Super Signal. Dieser benutzerfreundliche trendbasierte Indikator überwacht kontinuierlich die Marktbedingungen, sucht nach neuen sich entwickelnden Trends oder springt auf bestehende Trends ein. Das Beast Super Signal gibt ein Kauf- oder Verkaufssignal, wenn alle internen Strategien aufeinander ab
Gold Channel is a volatility-based indicator, developed with a specific timing algorithm for the XAUUSD pair, which consists of finding possible corrections in the market. This indicator shows two outer lines, an inner line (retracement line) and an arrow sign, where the theory of the channel is to help identify overbought and oversold conditions in the market. The market price will generally fall between the boundaries of the channel. If prices touch or move outside the channel it is a tradi
Wir stellen vor       Quantum Trend Sniper Indicator   , der bahnbrechende MQL5-Indikator, der die Art und Weise, wie Sie Trendumkehrungen erkennen und handeln, verändert! Entwickelt von einem Team erfahrener Händler mit über 13 Jahren Handelserfahrung,       Quantum Trend Sniper-Indikator       wurde entwickelt, um Ihre Trading-Reise mit seiner innovativen Methode zur Identifizierung von Trendumkehrungen mit extrem hoher Genauigkeit auf ein neues Niveau zu heben. ***Kaufe Quantum Trend Sniper
Royal Scalping Indicator M4
Vahidreza Heidar Gholami
4.17 (6)
Royal Scalping Indicator is an advanced price adaptive indicator designed to generate high-quality trading signals. Built-in multi-timeframe and multi-currency capabilities make it even more powerful to have configurations based on different symbols and timeframes. This indicator is perfect for scalp trades as well as swing trades. Royal Scalping is not just an indicator, but a trading strategy itself. Features Price Adaptive Trend Detector Algorithm Multi-Timeframe and Multi-Currency Trend Low
Reversal Pattern AI is a groundbreaking advancement in indicator development, combining artificial intelligence algorithms, multi-level market analysis, and classical technical analysis methods. It not only detects reversal patterns but also evaluates market inefficiencies, generating highly accurate trading signals.Thanks to its hybrid model, which utilizes price action analysis, volume, volatility, VWAP, and Volume AVG %, the indicator easily adapts to any market conditions. Reversal Pattern A
CONTACT US  after purchase to get the Indicator Manual. Try Now—Limited Discount for the next 10 Buyers! Download the  Metatrader 5 Version Read the product description carefully before purchasing the product.  Due to regulatory restrictions, our service is unavailable in certain countries such as India, Pakistan, and Bangladesh. Disclaimer: • Our products are available only on mql5.com. • We never contact anyone or sell our products privately. • We do not provide any personal trading advice.
Smart Set up Levels
Mohit Dhariwal
5 (1)
Smart Set up leve l is a very powerful indicator based on the concept of order blocks and set up entries with proper fvg and breakouts to make a very nice level to enter like a pro trader. Very easy to use interface and friendly to enter on buy and sell signals. Works Best on M15 Time frame on Gold, Bitcoin and Fx pairs. Daily 4-5 trades on each pair  Works great on gold like a pro on M15 It is non repainting nor lagging It is very powerful indicator giving precise entries and prop acts can be c
StalkeR Arrow
Abdulkarim Karazon
5 (3)
StalkeR Arrow ist ein Pfeilindikator, der Kauf- und Verkaufssignale beim Öffnen/Intra-Bar des Balkens gibt. Dieser Indikator basiert auf Preisaktionsmustern und Fraktalen Dieser Indikator gibt tp und sl für jedes Kauf- und Verkaufssignal an. tp und sl liegen in Form von Linien über und unter jedem Signal vor und verlängern sich, bis ein neues Signal gebildet wird Dieser Indikator verfügt über ein Backtesting-Panel/Dashboard, das Gewinn-/Verluststatistiken von Verlaufssignalen liefert. Dieser In
TrendMaestro
Stefano Frisetti
5 (3)
note: this indicator is for METATRADER4, if you want the version for METATRADER5 this is the link:  https://www.mql5.com/it/market/product/108106 TRENDMAESTRO ver 2.4 TRENDMAESTRO recognizes a new TREND in the bud, he never makes mistakes. The certainty of identifying a new TREND is priceless. DESCRIPTION TRENDMAESTRO identifies a new TREND in the bud, this indicator examines the volatility, volumes and momentum to identify the moment in which there is an explosion of one or more of these data a
Smart Level Pro
Aleksandr Makarov
Smart Level Pro is a very powerful indicator based on the concept of order blocks and set entries with the right fvg and breakouts to create a very good entry level like a professional trader. Very easy to use interface and easy to enter on buy and sell signals. Bonus: When purchasing the indicator, Quantum Entry PRO is provided free of charge. The indicator does not repaint and does not change its data! Works best on M5-M15 timeframe for gold, bitcoin and currency pairs. 4-5 deals daily for eac
Weitere Produkte dieses Autors
Das Skript basiert auf der Simulation von Handelsgeschäften mit einem Zufallsgenerator. Auf diese Weise erhalten Sie auch bei gleichen Eingabeparametern völlig unterschiedliche Ergebnisse. Wenn Sie das Skript ausführen, wird ein Dialogfeld geöffnet, in dem Sie die gewünschten Werte für externe Variablen festlegen können. Im Block  TradingOptions  werden die grundlegenden Parameter definiert, die zur Simulation des Handels benötigt werden. StartBalance  - legt die Anfangsgröße der Handelsbilanz
FREE
MinDeposit MT5
Aleksej Poljakov
3 (1)
The script analyzes the history of quotes and gives recommendations on the minimum deposit. The calculations take into account the variability of prices and the standard deviation. Margin requirements for the instrument are also taken into account. The result of the script is the minimum recommended deposit for trading the given currency pair.
FREE
MinDeposit
Aleksej Poljakov
5 (1)
The script analyzes the history of quotes and gives recommendations on the minimum deposit. The calculations take into account the variability of prices and the standard deviation. Margin requirements for the instrument are also taken into account. The result of the script is the minimum recommended deposit for trading the given currency pair.
FREE
Dieses Skript ist so konzipiert, dass der Händler die durchschnittliche Dauer von Handelsgeschäften bestimmen kann, bei der das Verhältnis von möglichen Gewinnen und Verlusten optimal ist. Betrachten wir zunächst den allgemeinen Ansatz zur Bestimmung der optimalen Dauer von Handelsgeschäften. Wir führen die folgenden Variablen ein: R - das Ergebnis der Transaktion; T - die Zeit, während der die Transaktion offen war; W - Die Zeit zwischen dem Abschluss der vorherigen und dem Öffnen der nächsten
FREE
Die Auswahl der StopLoss- und TakeProfit-Stufen kann sich sehr stark auf die Gesamtperformance des Handels auswirken. Neben den offensichtlichen Parametern einer Transaktion - der Größe eines möglichen Gewinns oder wahrscheinlichen Verlusts - wirken sich die StopLoss- und TakeProfit-Werte auch auf die erwartete Dauer der Transaktion und die Rentabilität des Handels im Allgemeinen aus. Wenn Sie die optimale Transaktionsdauer bereits mithilfe des „ AIS-ODT “ -Skripts ermittelt haben, können Sie mi
FREE
Das Skript basiert auf der Simulation von Handelsgeschäften mit einem Zufallsgenerator. Auf diese Weise erhalten Sie auch bei gleichen Eingabeparametern völlig unterschiedliche Ergebnisse. Wenn Sie das Skript ausführen, wird ein Dialogfeld geöffnet, in dem Sie die gewünschten Werte für externe Variablen festlegen können. Im Block TradingOptions werden die grundlegenden Parameter definiert, die zur Simulation des Handels benötigt werden. StartBalance - legt die Anfangsgröße der Handelsbilanz fes
FREE
Dieses Skript ist so konzipiert, dass der Händler die durchschnittliche Dauer von Handelsgeschäften bestimmen kann, bei der das Verhältnis von möglichen Gewinnen und Verlusten optimal ist. Betrachten wir zunächst den allgemeinen Ansatz zur Bestimmung der optimalen Dauer von Handelsgeschäften. Wir führen die folgenden Variablen ein: R  - das Ergebnis der Transaktion; T  - die Zeit, während der die Transaktion offen war; W  - Die Zeit zwischen dem Abschluss der vorherigen und dem Öffnen der nächst
FREE
The script allows selecting the required 'Filter level' value of the AIS-MTF indicator. Run the script on the required chart and selected timeframe. Once its operation is complete, the HPS.csv file will be created in the Files folder. Open the file. You will see three columns. The 'Filter lvl' column represents the value of the 'Filter level' for the AIS-MTF indicator. Am. dev. - degree and direction of the indicator's deviation from the price level (sorted in ascending order). Negative values i
FREE
This script allows selecting the TakeProfit and StopLoss levels. It analyzes the history data, and then calculates the probability of reaching a given price level. How the script works Suppose you have a trading strategy and you want to select the TakeProfit and StopLoss levels. Run the script and set the parameter: Number of Bars - the average position holding time in bars. Once the script operation is complete, the AIS-PPL.csv file will be created in the Files folder in the terminal data cata
FREE
Mit dem Indikator AIS Correct Averages können Sie den Beginn einer Trendbewegung auf dem Markt festlegen. Eine weitere wichtige Eigenschaft des Indikators ist ein klares Signal für das Ende des Trends. Der Indikator wird nicht neu gezeichnet oder neu berechnet. Angezeigte Werte h_AE - Obergrenze des AE-Kanals l_AE - untere Grenze des AE-Kanals h_EC - Hoher vorhergesagter Wert für den aktuellen Balken l_EC - Niedriger vorhergesagter Wert für den aktuellen Balken Signale beim Arbeiten mit de
Der Indikator AIS Weighted Moving Average berechnet einen gewichteten gleitenden Durchschnitt und ermöglicht es Ihnen, den Beginn einer Trendmarktbewegung zu bestimmen. Die Gewichtskoeffizienten werden unter Berücksichtigung der Besonderheiten jedes Barrens berechnet. Auf diese Weise können Sie zufällige Marktbewegungen herausfiltern. Das Hauptsignal, das den Beginn eines Trends bestätigt, ist eine Richtungsänderung der Indikatorlinien und der Preis, der die Indikatorlinien kreuzt. WH (blaue
Der AIS Advanced Grade Machbarkeitsindikator soll die Niveaus vorhersagen, die der Preis in der Zukunft erreichen könnte. Seine Aufgabe ist es, die letzten drei Balken zu analysieren und darauf basierend eine Prognose zu erstellen. Der Indikator kann für jeden Zeitrahmen und jedes Währungspaar verwendet werden. Mit Hilfe von Einstellungen erreichen Sie die gewünschte Qualität der Prognose. Vorhersagetiefe - legt die gewünschte Vorhersagetiefe in Balken fest. Es wird empfohlen, diesen Parameter
The indicator is designed to measure the price volatility. This allows determining the moments for opening or closing trade positions more accurately. High intensity of the market indicates the instability of its movement, but allows for better results. And, conversely, low intensity of the market indicates the stability of its movement. Parameters Bars to process - the number of bars to measure the price movements. A low value of this parameter allows determining the moments of rapid price mov
This indicator uses the Fibonacci p-numbers to smooth a price series. This allows combining the advantages of the simple and exponential moving averages. The smoothing coefficients depend on the level of the p-number, which is set in the indicator parameters. The higher the level, the greater the influence of the simple moving average and the less significant the exponential moving average. Parameters Fibonacci Numbers Order - order of the Fibonacci p-number, specified by trader. Valid values a
The indicator is based on the analysis of interaction of two filters. The first filter is the popular Moving Average. It helps to identify linear price movements and to smooth minor price fluctuations. The second filter is the Sliding Median. It is a non-linear filter. It allows to filter out noise and single spikes in the price movement. A predictive filter implemented in this indicator is based on the difference between these filters. The indicator is trained during operation and is therefore
This indicator studies the price action as a combination of micro-trends. All micro-trends are analyzed and averaged. Price movement is filtered based on this averaging. IP_High and IP_Low (blue and red dashed lines) show the instantaneous price movement. They display the forecast only for the current price values, taking into account only the number of bars defined by the 'Filter level' parameter. SP_High and SP_Low (blue and red solid lines) smooth the price movements with respect to history.
Dieser Indikator implementiert einen einfachen linearen Glättungsprozess. Einer der Nachteile der exponentiellen Glättung ist das schnelle Abklingen des Signals. Dies macht es unmöglich, langfristige Trends in der Preisspanne vollständig zu verfolgen. Mit der linearen Glättung können Sie die Signalfilterung genauer und feiner einstellen. Der Indikator wird durch Auswahl von Parametern konfiguriert: LP - Mit diesem Parameter können Sie die Glättungszeit auswählen. Je größer sein Wert, desto m
This script allows selecting the TakeProfit and StopLoss levels. It analyzes the history data, and then calculates the probability of reaching a given price level. How the script works Suppose you have a trading strategy and you want to select the TakeProfit and StopLoss levels. Run the script and set the parameter: Number of Bars - the average position holding time in bars. Once the script operation is complete, the AIS-PPL.csv file will be created in the Files folder in the terminal data cata
FREE
Dieser Indikator ist ein sequenzieller Hybridfilter, der auf einer Kombination von Median- und Gleitmittelwert-Eigenschaften basiert. Durch die Verwendung des Medianwerts können abnormale Ausreißer und zufällige Impulse in den Werten der Preisreihe herausgefiltert werden. Gleichzeitig wirkt sich der Medianfilter nicht auf den Trend der Preisbewegung aus und lässt ihn unverändert. Da der Medianfilter nichtlinear ist, werden die Werte mit einem einfachen gleitenden Durchschnitt gemittelt. Dieser
Dieser Indikator ist eine Kombination aus zwei modifizierten Lanczos-Filtern. Der erste Filter dient zur Extrapolation des Preises. Auf der Grundlage vergangener Werte prognostiziert er eine mögliche Kursbewegung innerhalb der aktuellen Bar. Das heißt, es zeigt, was der Preis wäre, wenn die Trends der Vergangenheit unverändert blieben. Der zweite Filter zum Glätten und Mitteln der Preise innerhalb des Fensters, bestimmt durch den Filterpegel. Durch die Auswahl der Gewichte reagiert dieser Filter
Betrachten wir die Art der Preisänderungen auf dem Forex-Markt, ohne auf die Gründe zu achten, warum diese Änderungen auftreten. Mit diesem Ansatz können wir die Hauptfaktoren identifizieren, die die Preisbewegung beeinflussen. Nehmen wir zum Beispiel die Eröffnungskurse von Barren für das Währungspaar EUR-USD und den Zeitraum für das erste Halbjahr. Für diese Preise konstruieren wir das Lameray-Diagramm (Abbildung 1). In diesem Diagramm ist ersichtlich, dass die Preisbewegung grundsätzlich nach
Dieser Indikator ist informativer. Seine Arbeit basiert auf der Annahme, dass die Preisbewegung auf dem Markt als Rauschen einer bestimmten Farbe dargestellt werden kann, das von den Parametern der Verteilung der Preiswerte abhängt. Dadurch ist es möglich, die Preisänderung aus verschiedenen Blickwinkeln zu analysieren und die Preisbewegung als Rauschen einer bestimmten Farbe zu betrachten, Informationen über den aktuellen Stand des Marktes zu erhalten und eine Prognose über das Preisverhalten
Trotz einiger Nachteile des Indikators „ AIS Color Noise Filter “ erscheint die Idee, ihn zur Glättung der Preisreihen und der prognostizierten Preise zu verwenden, recht attraktiv. Dies hat mehrere Gründe: Erstens ermöglicht die Berücksichtigung mehrerer Lärmkomponenten die Erstellung einer Prognose auf Grundlage voneinander unabhängiger Faktoren, wodurch die Prognosequalität verbessert werden kann. zweitens verhalten sich die Rauschmerkmale der Preisreihen über die gesamte Historie hinweg rec
Sehr häufig werden bei der Untersuchung von Finanzreihen deren Glättungen angewendet. Mit der Glättung können Sie hochfrequente Komponenten entfernen - es wird angenommen, dass sie durch zufällige Faktoren verursacht werden und daher irrelevant sind. Die Glättung beinhaltet immer eine Art der Mittelung der Daten, bei der sich zufällige Änderungen in den Zeitreihen gegenseitig absorbieren. Zu diesem Zweck werden meist einfache oder gewichtete gleitende Durchschnittsmethoden sowie eine exponentie
Um langfristige und nicht zufällige Komponenten zu isolieren, muss nicht nur bekannt sein, um wie viel sich der Preis geändert hat, sondern auch, wie sich diese Änderungen ereignet haben. Mit anderen Worten - wir interessieren uns nicht nur für die Werte der Preisniveaus, sondern auch für die Reihenfolge, in der sich diese Niveaus gegenseitig ersetzen. Durch diesen Ansatz kann man langfristige und stabile Faktoren finden, die die Preisänderung zu einem bestimmten Zeitpunkt beeinflussen (oder be
Eine der leistungsstarken Analysemethoden ist die Modellierung von Finanzreihen mithilfe von Levy-Prozessen. Der Hauptvorteil dieser Prozesse besteht darin, dass mit ihnen eine Vielzahl von Phänomenen modelliert werden kann - von den einfachsten bis zu den komplexesten. Es genügt zu sagen, dass die Idee der fraktalen Preisbewegung auf dem Markt nur ein Sonderfall von Levy-Prozessen ist. Andererseits kann bei richtiger Auswahl der Parameter jeder Levy-Prozess als einfacher gleitender Durchschnit
Sehr oft steht der Händler vor der Aufgabe, das Ausmaß zu bestimmen, in dem sich der Preis in naher Zukunft ändern kann. Zu diesem Zweck können Sie die Johnson-Verteilungsart SB verwenden. Der Hauptvorteil dieser Verteilung besteht darin, dass sie auch mit einer kleinen Menge von akkumulierten Daten verwendet werden kann. Der empirische Ansatz zur Bestimmung der Parameter dieser Verteilung ermöglicht es Ihnen, das maximale und minimale Niveau des Preiskanals genau zu bestimmen. Diese Werte könn
Mit diesem Indikator können Sie die Wahrscheinlichkeit bestimmen, mit der der Preis das eine oder andere Niveau erreicht. Der Algorithmus ist recht einfach und basiert auf der Verwendung statistischer Daten zum Preisniveau eines bestimmten Währungspaares. Dank der gesammelten historischen Daten ist es möglich, das Ausmaß zu bestimmen, in dem sich der Preis während des aktuellen Balkens ändert. Trotz seiner Einfachheit kann dieser Indikator beim Handel von unschätzbarem Wert sein. Mit seiner Hil
Nachhaltige Ausschüttungen können zur Glättung von Finanzserien eingesetzt werden. Da zur Berechnung der Verteilungsparameter eine relativ tiefe Historie verwendet werden kann, kann eine solche Glättung in einigen Fällen im Vergleich zu anderen Methoden sogar noch effektiver sein. Die Abbildung zeigt beispielhaft die Verteilung der Eröffnungskurse des Währungspaares EUR-USD im ersten Halbjahr über zehn Jahre (Abbildung 1). Es sieht faszinierend aus, nicht wahr? Die Hauptidee, die diesem Indik
Auswahl:
Keine Bewertungen
Antwort auf eine Rezension