• Übersicht
  • Bewertungen (3)
  • Diskussion (5)
  • Neue Funktionen

PZ Mean Reversion MT4

2.33

Einzigartiger Indikator, der einen professionellen und quantitativen Ansatz für Mean-Reversion-Trading umsetzt. Es nutzt die Tatsache, dass der Preis auf vorhersehbare und messbare Weise umlenkt und zum Mittelwert zurückkehrt, was klare Ein- und Ausstiegsregeln ermöglicht, die nicht-quantitative Handelsstrategien bei weitem übertreffen.

[ Installation Guide | Update Guide | Troubleshooting | FAQ | All Products ]

  • Klare Handelssignale
  • Erstaunlich einfach zu handeln
  • Anpassbare Farben und Größen
  • Implementiert Leistungsstatistiken
  • Übertrifft die meisten Handelsstrategien
  • Zeigt geeignete SL- und TP-Pegel an
  • Es implementiert E-Mail/Sound/visuelle Warnungen
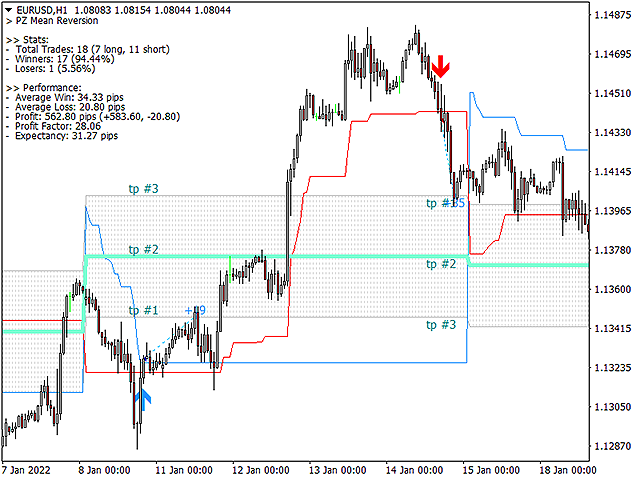
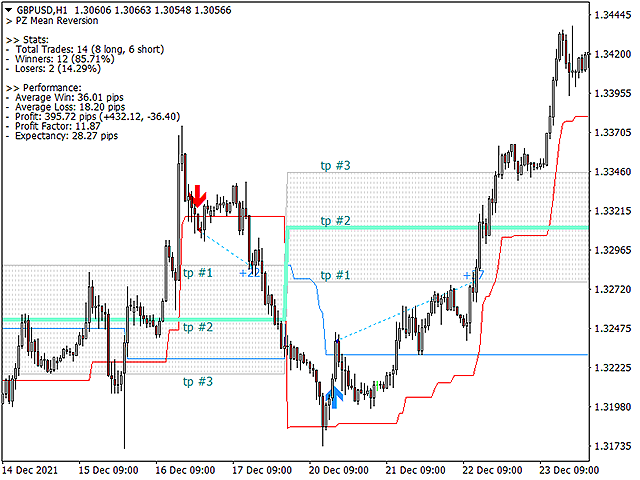

Wie es funktioniert

Der Indikator misst die Standardabweichung um einen vollständig anpassbaren gleitenden Durchschnitt aus einem höheren Zeitrahmen und verwendet einen trendfolgenden Ansatz, um Trades mit Präzision zu finden. Trades werden gefunden, indem Sie in die Preisbewegung des aktuellen Charts eintauchen und geschlossen werden, wenn der Preis in das mittlere Preisband zurückkehrt, berechnet aus einem höheren Zeitrahmen Ihrer Wahl. Aufgrund der Art und Weise, wie er codiert ist, hält sich der Indikator von Märkten mit hoher Volatilität und starken Trends fern und handelt nur mit vorhersehbaren Szenarien, in denen eine Rückkehr zum Mittelwert innerhalb eines akzeptablen Verhältnisses von Volatilität zu Direktionalität möglich ist.

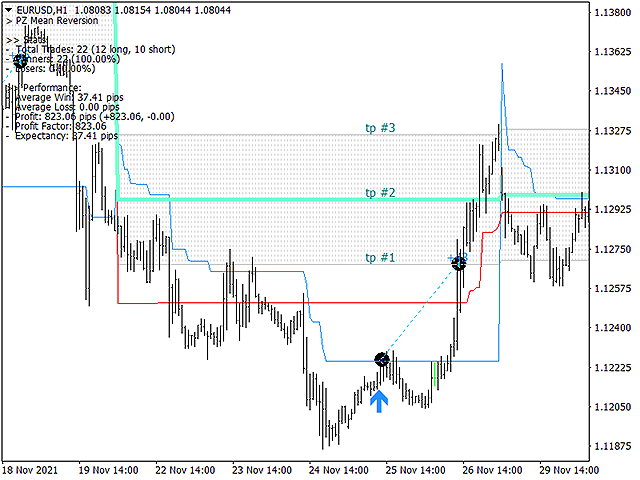
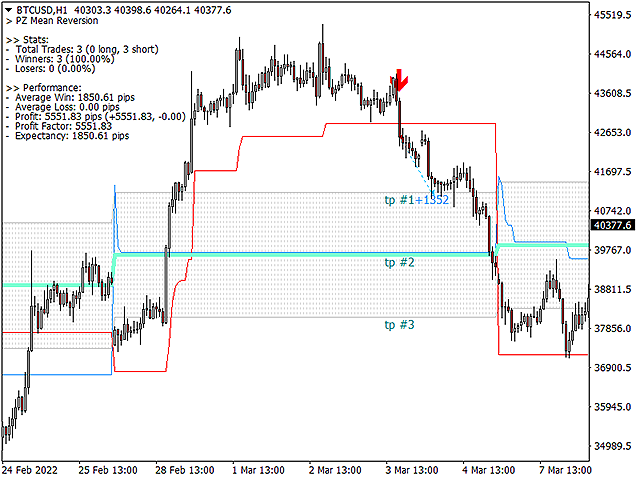
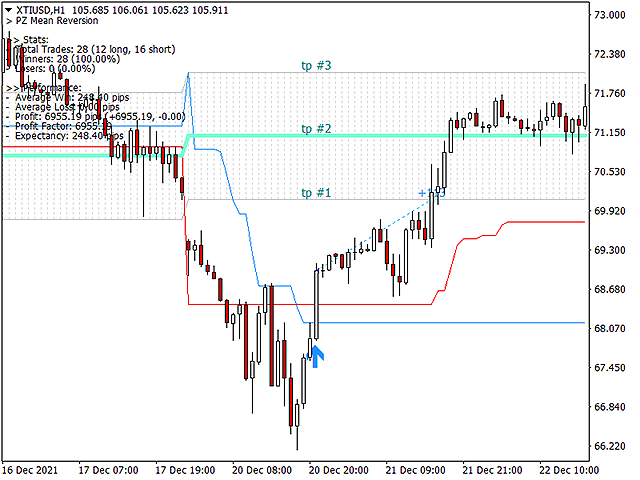
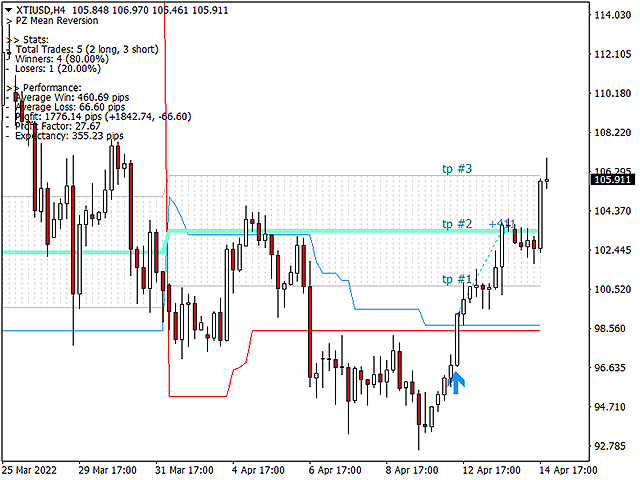
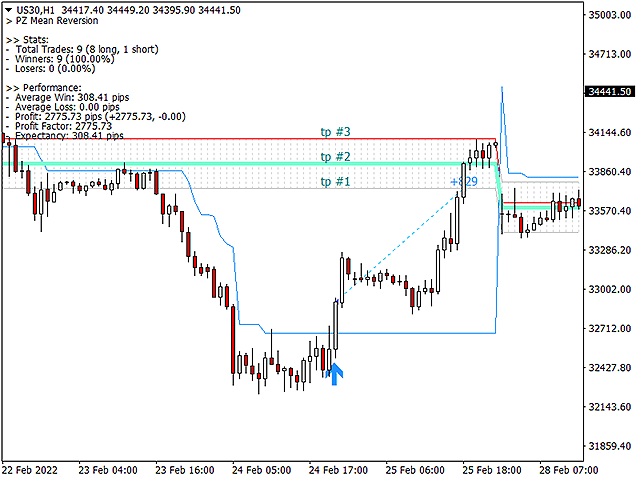
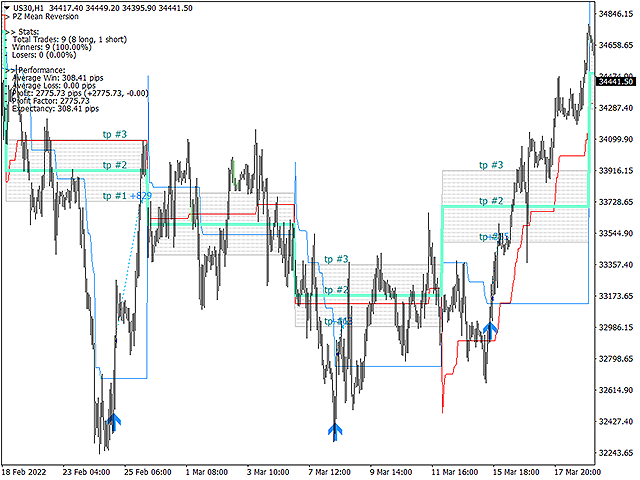
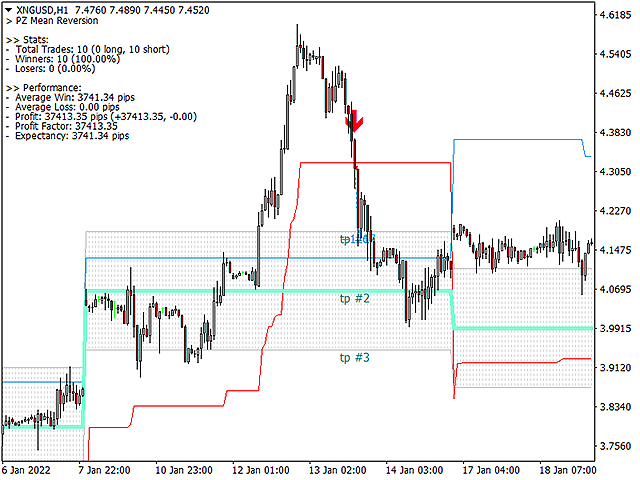
Anatomie des Indikators

  • Die grüne Linie ist der gleitende Durchschnitt aus einem höheren Zeitrahmen (auch bekannt als der Mittelwert).
  • Der gepunktete Bereich ist das typische Preisband um den gleitenden Durchschnitt
  • Die blaue Linie ist der Ausbruchspreis für bullische Trades
  • Die rote Linie ist der Ausbruchspreis für rückläufige Trades

Trades werden gegen den Mittelwert getätigt und innerhalb der typischen Preisspanne geschlossen.


Was tauschen

Mean-Reversion findet immer in praktisch allen Märkten statt.

  • Forex-Paare
  • Aktienindizes
  • Edelmetalle
  • Rohstoffe
  • Kryptowährungen
  • Fesseln

Empfohlene Zeitrahmen

  • H4 mit MN1 Gleitender Durchschnitt
  • H1 mit W1 Gleitender Durchschnitt
  • M15 mit D1 Gleitender Durchschnitt
  • M1 mit H4 Gleitender Durchschnitt

Eingabeparameter

Für eine detaillierte Beschreibung aller Eingabeparameter des Indikators klicken Sie hier .


    Autor

    Arturo López Pérez, Privatinvestor und Spekulant, Softwareentwickler und Gründer von PZ Trading Solutions.
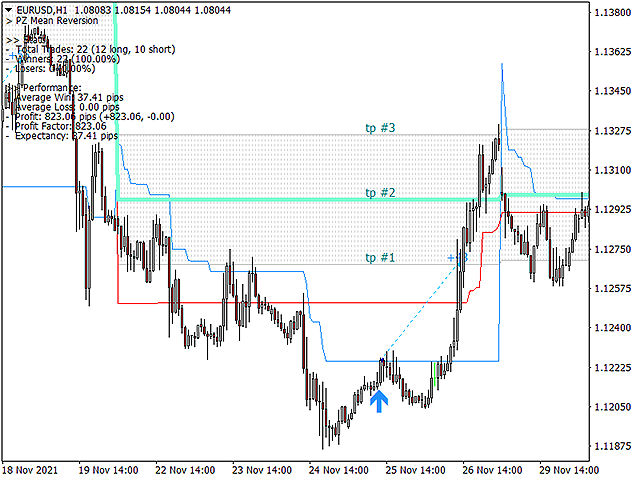
    Bewertungen 3
    Frank Paetsch
    7067
    Frank Paetsch 2024.03.22 11:08 
     

    Thank you

    Empfohlene Produkte
    VR Cub
    Vladimir Pastushak
    VR Cub ist ein Indikator für den Erhalt hochwertiger Einstiegspunkte. Der Indikator wurde entwickelt, um mathematische Berechnungen zu erleichtern und die Suche nach Einstiegspunkten in eine Position zu vereinfachen. Die Handelsstrategie, für die der Indikator geschrieben wurde, hat sich seit vielen Jahren bewährt. Ihr großer Vorteil liegt in der Einfachheit der Handelsstrategie, die es auch unerfahrenen Händlern ermöglicht, erfolgreich damit zu handeln. VR Cub berechnet Positionseröffnungspunkt
    Owl smart levels
    Sergey Ermolov
    4.58 (55)
    MT5-Version  |  FAQ Der   Owl Smart Levels Indikator   ist ein komplettes Handelssystem innerhalb eines Indikators, der so beliebte Marktanalysetools wie die   fortschrittlichen Fraktale von Bill Williams , Valable ZigZag, das die   richtige Wellenstruktur   des Marktes aufbaut, und   Fibonacci-Levels , die die genauen Einstiegslevels markieren, enthält in den Markt und Orte, um Gewinne mitzunehmen. Detaillierte Strategiebeschreibung Anleitung zur Verwendung des Indikators Berater-Assistent im
    Strong Retracement Points Pro demo edition! SRP (Strong Retracement/Reversal Points) is a powerful and unique support and resistance indicator. It displays the closest important levels which we expect the price retracement/reversal! If all level are broken from one side, it recalculates and draws new support and resistance levels, so the levels might be valid for several days depending on the market! If you are still hesitating to start using this wonderful tool, you can check this link to see h
    Noize Absorption Index MT4
    Ekaterina Saltykova
    5 (1)
    Noize Absorption Index - is the manual trading system that measures the difference of pressure between bears forces and bulls forces. Green line - is a noize free index that showing curent situation. Zero value of index shows totally choppy/flat market.Values above zero level shows how powerfull bullish wave is and values below zero measures bearish forces.Up arrow appears on bearish market when it's ready to reverse, dn arrow appears on weak bullish market, as a result of reverse expectation. S
    The Th3Eng PipFinite indicator is based on a very excellent analysis of the right trend direction with perfect custom algorithms. It show the true direction and the best point to start trading. With StopLoss point and Three Take Profit points. Also it show the right pivot of the price and small points to order to replace the dynamic support and resistance channel, Which surrounds the price. And Finally it draws a very helpful Box on the left side on the chart includes (take profits and Stop loss
    Shark Deal Book
    Philip Pankaj Suthagar
    4 (3)
    Term  "shark"  in the business world denotes a high volume investor who just made a good investment in a highly Potential business deal.So, sharks are the ones who make the market move. In our case, if an American shark bought a Japanese company, he/she has to convert American dollars into Japanese yen to make the deal. So, the demand for the Japanese yen will increase sharply. Thus USD/JPY will go short rapidly if the deal was from the shark. Another example, In the case of forex, if fed increa
    Volume by Price MT4
    Brian Collard
    4.71 (14)
    The Volumebyprice.com Indicator for MetaTrader 4 features Volume Profile and Market Profile TPO (Time Price Opportunity). Volume and TPO histogram bar and line charts. Volume Footprint charts. TPO letter and block marker collapsed and split structure charts. Static, dynamic and flexible range segmentation and compositing methods with relative and absolute visualizations. Session hours filtering and segment concatenation with Market Watch and custom user specifications. Graphical layering, posit
    Infinity Trend Pro
    Yaroslav Varankin
    1 (1)
    This is a trend indicator without redrawing Developed instead of the binary options strategy (by the color of the Martingale candlestick) Also works well in forex trading When to open trades (binary options) A signal will appear in the place with a candle signaling the current candle It is recommended to open a deal for one candle of the current timeframe M1 and M5 When a blue dot appears, open a deal up When a red dot appears, open a trade down. How to open trades on Forex. When a signal is rec
    Trend Ray
    Andriy Sydoruk
    The indicator shows the potential trend direction by cyclical-wave dependence. Thus, all the rays of the intersection will be optimal rays, in the direction of which the price is expected to move, taking into account the indicator period. Rays can be used as a direction for potential market movement. But we must not forget that the approach must be comprehensive, the indicator signals require additional information to enter the market.
    Daily Candle Predictor ist ein Indikator, der den Schlusskurs einer Kerze vorhersagt. Der Indikator ist in erster Linie für die Verwendung in D1-Charts gedacht. Dieser Indikator eignet sich sowohl für den traditionellen Devisenhandel als auch für den Handel mit binären Optionen. Der Indikator kann als eigenständiges Handelssystem oder als Ergänzung zu Ihrem bestehenden Handelssystem verwendet werden. Dieser Indikator analysiert die aktuelle Kerze und berechnet bestimmte Stärkefaktoren innerhalb
    Royal Dutch Skunk
    Sayan Vandenhout
    ROYAL DUTCH SKUNK USES THE TREND WAVE INDICATOR AND IT CAN IDENTIFY THE BEGINNING AND THE END OF A NEW WAVE TREND MOVEMENT. AS AN OSCILLATOR, THE INDICATOR IDENTIFIES THE OVERBOUGHT AND OVERSOLD ZONES. IT WORKS GREAT TO CATCH THE SHORT TERM PRICE REVERSALS AND USES A MARTINGALE STRATEGY TO CLOSE ALL TRADES IN PROFIT. USE DEFAULT SETTINGS ON H1 OR HIGHER TIME FRAME ON ANY PAIR FOR MORE ACCURATE TRADES WHY THIS EA : Smart entries calculated by 6 great strategies The EA can be run on even a $20000
    Next level of trend trading here. Possibility 75%, the indicator analyzes the current market to determine short (small dot), middle (circle with a dot inside) and long (cross with a circle and a dot inside) trends.  Wingdings characters of  Aqua color represents the beginning of the UP trend. Wingdings characters of  Orange color represents the beginning of the DOWN trend. Possibility 75% Indicator will improve your trading in the world of forex, commodities, cryptocurrencies and indices.
    TWO PAIRS SQUARE HEDGE METER INDICATOR Try this brilliant 2 pairs square indicator It draws a square wave of the relation between your two inputs symbols when square wave indicates -1 then it is very great opportunity to SELL pair1 and BUY Pair2 when square wave indicates +1 then it is very great opportunity to BUY pair1 and SELL Pair2 the inputs are : 2 pairs of symbols         then index value : i use 20 for M30 charts ( you can try other values : 40/50 for M15 , : 30 for M30 , : 10 for H1 ,
    ZhiBiCCI MT4
    Qiuyang Zheng
    5 (1)
    [ZhiBiCCI] Indikatoren sind für alle Zyklusanwendungen und auch für alle Marktsorten geeignet. [ZhiBiCCI] Die grüne durchgezogene Linie ist eine Umkehrung der bullischen Divergenz. Die grüne gestrichelte Linie ist eine klassische bullische Divergenz. [ZhiBiCCI] Die durchgehende Linie zum Rot ist eine umgekehrte bearishe Divergenz. Die rote gepunktete Linie ist eine klassische bearishe Divergenz. [ZhiBiCCI] kann in den Parametern (Alert, Mail senden, Benachrichtigung senden) eingestellt wer
    Cosmic Diviner X Planet
    Olena Kondratenko
    4 (2)
    This unique multi-currency strategy simultaneously determines the strength of trends and market entry points, visualizing this using histograms on the chart. The indicator is optimally adapted for trading on the timeframes М5, М15, М30, Н1. For the convenience of users, the indicator renders the entry point (in the form of an arrow), recommended take profit levels (TP1, TP2 with text labels) and the recommended Stop Loss level. The take profit levels (TP1, TP2) are automatically calculated for
    TrendPlus
    Sivakumar Subbaiya
    4.21 (14)
    Trend Plus   Trendplus  Indicator   Time Frame: Suitable for any time frame.  Purpose: Trend Prediction. Blue and red candle indicate the buy and sell call respectively. Buy: When the blue candle is formed buy call is initiated. close the buy trades when the next red candle will formed.   Sell: When the Red candle is formed Sell call is initiated. close the Sell trades when the next blue candle will formed.   Happy trade!!
    FREE
    Binary Options Support Resistance Indicator This indicator is designed for binary options trading and effectively shows retracements from support and resistance levels. Signals appear on the current candle. A red arrow pointing downwards indicates a potential selling opportunity, while a blue arrow pointing upwards suggests buying opportunities. All that needs adjustment is the color of the signal arrows. It is recommended to use it on the M1-M5 timeframes as signals are frequent on these timef
    This is a new strategy for SUPPLY DEMAND areas It is based on a calculation using the tick volume to detect the big price action in market for both bear /bull actions this smart volume action candles are used to determine the supply and demand areas prices in between main supply and demand lines indicate sideway market  up arrows will be shown when prices moves above the main supply and the secondary supply lines Down arrows will be shown when prices moves below the main demand and the secondary
    For sure, this indicator has become very popular amongst traders. Through coding this indicator will give you the most accurate levels possible for your trading analysis. We have also added in the ability for you to receive alerts when the price breaks above or below a Support or Resistance lines! HOW TO USE The red rectangles represent your resistance/supply zone. The green rectangles represent your support/demand zone.  BONUS FEATURES We coded this indicator with the ability to switch between
    The Infinity Expert Advisor is a scalper. When the resistance and support levels are broken, trades are opened in the direction of the price movement. Open positions are managed by several algorithms based on the current market situation (fixed stop loss and take profit, trailing stop, holding positions in case of trend indication, etc.). Requirements for the broker The EA is sensitive to spread, slippages and execution quality. It is strongly recommended not to use the EA for currencies with
    Harvest GOLD
    Sayan Vandenhout
    Harvest GOLD USES THE TREND WAVE INDICATOR AND IT CAN IDENTIFY THE BEGINNING AND THE END OF A NEW WAVE TREND MOVEMENT. AS AN OSCILLATOR, THE INDICATOR IDENTIFIES THE OVERBOUGHT AND OVERSOLD ZONES. IT WORKS GREAT TO CATCH THE SHORT TERM PRICE REVERSALS AND USES A MARTINGALE STRATEGY TO CLOSE ALL TRADES IN PROFIT. USE DEFAULT SETTINGS ON H1 OR HIGHER TIME FRAME ON ANY PAIR FOR MORE ACCURATE TRADES WHY THIS EA : Smart entries calculated by 3 great strategies The EA can be run on even a $
    Indikator. "Indikatorwelle oder Indikator Ma". Unter Verwendung von 23 Standardindikatoren und dem Algorithmus des Autors werden die Einkäufe (von 0 bis +100) und die Verkäufe (von 0 bis -100) berechnet. Dann zeichnet der "Wave Indicator" mit den berechneten Levels eine Welle mit 21 gleitenden Durchschnitten. Die Wellenzahl entspricht der Mittelungsperiode der berechneten Pegel. Wellen Nr. 1 - 7 sich schnell bewegende Durchschnitte Wellen von Nr. 8 bis 14 gleitender Durchschnitte Well
    Trendiness Index
    Libertas LLC
    5 (3)
    "The trend is your friend" is one of the best known sayings in investing, because capturing large trendy price movements can be extremely profitable. However, trading with the trend is often easier said than done, because many indicators are based on price reversals not trends. These aren't very effective at identifying trendy periods, or predicting whether trends will continue. We developed the Trendiness Index to help address this problem by indicating the strength and direction of price trend
    We present you the indicator "Candle closing counter", which will become your indispensable assistant in the world of trading. That’s why knowing when the candle will close can help: If you like to trade using candle patterns, you will know when the candle will be closed. This indicator will allow you to check if a known pattern has formed and if there is a possibility of trading. The indicator will help you to prepare for market opening and market closure. You can set a timer to create a p
    Quantum Heiken Ashi PRO MT4
    Bogdan Ion Puscasu
    4.43 (7)
    Wir stellen vor       Quantum Heiken Ashi PRO-   Charts Die Heiken-Ashi-Kerzen wurden entwickelt, um klare Einblicke in Markttrends zu geben und sind bekannt für ihre Fähigkeit, Rauschen herauszufiltern und falsche Signale zu eliminieren. Verabschieden Sie sich von verwirrenden Preisschwankungen und begrüßen Sie eine glattere, zuverlässigere Diagrammdarstellung. Was den Quantum Heiken Ashi PRO wirklich einzigartig macht, ist seine innovative Formel, die traditionelle Candlestick-Daten in leicht
    Indicator for binary options arrow is easy to use and does not require configuration works on all currency pairs, cryptocurrencies buy signal blue up arrow sell signal red down arrow tips do not trade during news and 15-30 minutes before their release, as the market is too volatile and there is a lot of noise it is worth entering trades one or two candles from the current period (recommended for 1 candle) timeframe up to m 15 recommended money management fixed lot or fixed percentage of the depo
    Diamond PRO
    Fanur Galamov
    4.83 (18)
    Diamond PRO is enhanced powerful version of Diamond for advanced traders. Pro version includes optimized cores, new impoved entry points filters, new multistage profit closure algorithm and сontains number of external control parameter that allows build and fine tune own tradind decisions and algorithms. The system provides more accurate market entries, analyzes and filters upcoming economic news, contains spread protection and an advanced position management algorithm. Main goal of Diamond PRO
    The indicator displays the data of the Stochastic oscillator from a higher timeframe on the chart. The main and signal lines are displayed in a separate window. The stepped response is not smoothed. The indicator is useful for practicing "manual" forex trading strategies, which use the data from several screens with different timeframes of a single symbol. The indicator uses the settings that are identical to the standard ones, and a drop-down list for selecting the timeframe. Indicator Parame
    KT Renko Patterns MT4
    KEENBASE SOFTWARE SOLUTIONS
    2.33 (3)
    KT Renko Patterns scans the Renko chart brick by brick to find some famous chart patterns that are frequently used by traders across the various financial markets. Compared to the time-based charts, patterns based trading is easier and more evident on Renko charts due to their uncluttered appearance. KT Renko Patterns features multiple Renko patterns, and many of these patterns are extensively explained in the book titled Profitable Trading with Renko Charts by Prashant Shah. A 100% automate
    Unser Basic Support and Resistance Indikator ist die Lösung, die Sie für die Steigerung Ihrer technischen Analyse benötigen.Mit diesem Indikator können Sie Support- und Widerstandsebenen in der Tabelle projizieren/ MT5 -Version Funktionen Integration von Fibonacci -Ebenen: Mit der Option, Fibonacci -Werte neben Unterstützung und Widerstandsniveau anzuzeigen, gibt unser Indikator einen noch tieferen Einblick in das Marktverhalten und mögliche Umkehrbereiche. Leistungsoptimierung: Mit der Op
    Käufer dieses Produkts erwarben auch
    Enigmera
    Ivan Stefanov
    5 (4)
    ENIGMERA: Der Kern des Marktes https://www.enigmera.com Einführung Dieser Indikator und dieses Handelssystem sind ein bemerkenswerter Ansatz für die Finanzmärkte. ENIGMERA nutzt die fraktalen Zyklen zur genauen Berechnung von Unterstützungs- und Widerstandsniveaus. Er zeigt die echte Akkumulationsphase an und gibt Richtung und Ziele vor.  Ein System, das funktioniert, egal ob wir uns in einem Trend oder in einer Korrektur befinden.  Wie funktioniert es? ENIGMERA besteht aus drei Linien: der
    Gold Channel is a volatility-based indicator, developed with a specific timing algorithm for the XAUUSD pair, which consists of finding possible corrections in the market. This indicator shows two outer lines, an inner line (retracement line) and an arrow sign, where the theory of the channel is to help identify overbought and oversold conditions in the market. The market price will generally fall between the boundaries of the channel. If prices touch or move outside the channel it is a tra
    BITTE LESEN SIE DIE INFORMATIONEN UNTEN, BEVOR SIE DAS PRODUKT KAUFEN! Apollo Pips PLUS SP ist ein einzigartiges Produkt! ES IST FÜR ALLE, DIE MEINEN NEUEN „APOLLO PIPS“-INDIKATOR PLUS „SUPER PACK“-BONUS MIT ZUGRIFF AUF ALLE MEINE HANDELSINDIKATOREN ERHALTEN MÖCHTEN! Mit dem Kauf des Produkts Apollo Pips PLUS SP erwerben Sie tatsächlich eine völlig neue Version meines Apollo Pips-Indikators. Diese Version des Indikators verfügt über einen verbesserten Algorithmus und einen benutzerfreundlichen P
    This product is based on the methodologies of Gann, his follower Don E. Hall. The Indicator builds a working view grid, which is used to analyze graphics. The Pyrapoint tool, developed by Don Hall, is a grid based on the Pythagorean cube. In his calculations he uses the Gann Square 9 methodology and the relationship between Price and Time. This tool is used to predict changes in trend and overall market actions. More information about the method   HERE
    Max Paynex
    Abdulkarim Karazon
    Max Payne ist ein Umkehr-/Trendsignalindikator, der Signale in Form eines Pfeils ausgibt. Dieser Indikator gibt sein Signal beim Schließen desselben Balkens aus. Dieser Indikator kann mehrmals mit unterschiedlichen Perioden auf dem Chart fallen, um eine doppelte/dreifache Bestätigung der Signale zu erhalten Der Indikator ist hochgradig anpassbar, um sich an jeden Handelsstil anzupassen, während er niemals neu lackiert oder rücklackiert wird. Sie erhalten nach dem Kauf das gesamte System, das in
    JULY OFFER 80% OFF next price for unlimited version will be 17000$. This is the only time you can get this institutional and professional indicator at this price for unlimited version. Don't dare to miss this. The tool I am about to introduce to you you can't compare it with other tools due to its strategy and accuracy level in predicting the next price directional movement . This tool is designed for serious traders who have decided to make a difference through trading. Be the next person to wi
    Dear Traders this is my another tool called " Swing Master Indicator ". As the name above the indicator is designed to help you in swing trading by capturing the low and highs of the price. You may us this tool with any trading strategy and style from scalping to position trading. It is made for level of traders including newbies and advanced traders even prop-firms, hedge funds and banks to help them make sold market analysis. I create tools for serious traders who want to make a difference in
    Indicator : RealValueIndicator Description : RealValueIndicator is a powerful tool designed specifically for trading on the EURUSD pair. This indicator analyzes all EUR and USD pairs, calculates their real currency strength values, and displays them as a single realistic value to give you a head start on price. This indicator will tell you moves before they happen if you use it right. RealValueIndicator allows you to get a quick and accurate overview of the EURUSD currency pair tops and bottoms,
    Bomb Bank Signal
    Igor Pereira Calil
    Bombenbanksignal: Ihr Vertrauensindikator in MetaTrader 4 Bomb Bank Signal ist ein leistungsstarker Indikator für MetaTrader 4, der entwickelt wurde, um die relevantesten Trends auf dem Finanzmarkt zu identifizieren. Wenn Sie nach einem Tool suchen, das Bewegungen genau vorhersieht, ist die Bomb Bank der Verbündete, den Sie brauchen. So funktioniert es: Dieser Indikator kombiniert drei unterschiedliche Methoden – Volumenanalyse, Kerzenschließungen und symmetrischer Trend –, um Kauf- und V
    How to use Pair Trading Station Pair Trading Station is recommended for H1 time frame and you can use it for any currency pairs. To generate buy and sell signal, follow few steps below to apply Pair Trading Station to your MetaTrader terminal. When you load Pair Trading Station on your chart, Pair Trading station will assess available historical data in your MetaTrader platforms for each currency pair. On your chart, the amount of historical data available will be displayed for each currency pai
    The indicator is designed to work on any trading platform. The program is based on proprietary algorithms and W.D.Ganna's mathematics, allowing you to calculate target levels of price movement based on three points with the highest degree of certainty. It is a great tool for stock trading. The indicator has three buttons: NEW - call up a triangle for calculation. DEL - delete the selected triangle. DELS - completely remove all constructions. The probability of achieving the goals is more than 80
    Introduction to X3 Chart Pattern Scanner X3 Cherart Pattern Scanner is the non-repainting and non-lagging indicator detecting X3 chart patterns including Harmonic pattern, Elliott Wave pattern, X3 patterns, and Japanese Candlestick patterns. Historical patterns match with signal patterns. Hence, you can readily develop the solid trading strategy in your chart. More importantly, this superb pattern scanner can detect the optimal pattern of its kind. In addition, you can switch on and off individu
    Der Indikator „ ZigZag on Trend “ ist ein Assistent zur Bestimmung der Richtung der Preisbewegung sowie ein Balken- und Pip-Rechner. Es besteht aus einem Trendindikator, der die Richtung des Preises anhand einer Trendlinie in Form eines Zickzacks überwacht, und einem Zähler, der die Anzahl der in Trendrichtung durchlaufenen Balken und die Anzahl der Punkte auf einer vertikalen Skala berechnet. (Berechnungen werden bei der Eröffnung des Balkens durchgeführt) Der Indikator wird nicht neu gezeichne
    TrendMaestro
    Stefano Frisetti
    5 (3)
    note: this indicator is for METATRADER4, if you want the version for METATRADER5 this is the link:  https://www.mql5.com/it/market/product/108106 TRENDMAESTRO ver 2.4 TRENDMAESTRO recognizes a new TREND in the bud, he never makes mistakes. The certainty of identifying a new TREND is priceless. DESCRIPTION TRENDMAESTRO identifies a new TREND in the bud, this indicator examines the volatility, volumes and momentum to identify the moment in which there is an explosion of one or more of these data a
    Der TRANSACTION SPEED ist der hochwertigste Indikator, der anzeigt, wo und wann sich große Aufträge auf dem Markt ansammeln und welche Vorteile dies mit sich bringt. Er erkennt Trendänderungen in einem sehr frühen Stadium. Er ist gleichzeitig ein Indikator und ein Handelssystem. Das Konzept ist einzigartig und unglaublich profitabel. Im Devisenhandel wird das Tick-Volumen irreführenderweise als Volumen bezeichnet. In Wirklichkeit handelt es sich um die Preisveränderung pro Zeiteinheit, was de
    Natürlich, hier ist die Übersetzung in Deutsch: Vorstellung des Astronomie-Indikators für MT4: Dein ultimativer himmlischer Trading-Begleiter Bist du bereit, deine Trading-Erfahrung auf himmlische Höhen zu heben? Suche nicht weiter als unseren revolutionären Astronomie-Indikator für MT4. Dieses innovative Tool übertrifft herkömmliche Trading-Indikatoren und nutzt komplexe Algorithmen, um dir unvergleichliche astronomische Einblicke und präzise Berechnungen zu bieten. Ein Universum an Information
    Contact us to receive a comprehensive user guide after purchasing. William Delbert Gann, commonly known as W.D. Gann, was an exceptional market analyst renowned for his unique trading style in the early 20th century.  His trading techniques were based on a blend of mathematics, geometry, astrology, and ancient mathematics. Gann believed that stock market movements followed specific patterns and cycles, rather than being random. His methodologies, celebrated for their accuracy and relevance, con
    NOTE: PRICE WILL RISE VERY SOON. DON'T SKIP THIS OFFER! Dear traders I am glad to introduce the " Market Swing Scanner Board" indicator to you. This indicator was made mainly to be used in combination with the Market Swing Index Indicator. You use the  "Market Swing Scanner Board"  indicator to scan for trading opportunities on the  Market Swing Index Indicator . This tool is designed for serious traders who have decided to make a difference through trading. Be the next person to witness this st
    Gann Swing Structure
    Kirill Borovskii
    5 (1)
    This indicator is based on the mathematics of the great trader W.D. Ganna. With its help, you can easily find strong levels by analyzing swings to find the optimal entry point. The indicator works on all instruments and all timeframes. The indicator is fully manual and has control buttons. All you need to do is press the NEW button, a segment will appear, which you can place on any movement, swing or even 1 candle that you want to analyze. By placing the segment, press the OK button. A grid (th
    The indicator of a Professional Trader is an arrow indicator for predicting the direction of price movement. I have been working on this indicator since 2014. You can use this indicator as your main indicator, use its entry signals, and use it as your only indicator to find entry points. About the product: Recommended TF [H4-D1-W1]   . The indicator predicts the direction of the next candle. Fits a variety of tools; Flexibility in settings for different instruments and intervals through the
    Zyklischer Indikator für den Handel und die Prognose der Marktrichtung. Zeigt das zyklische Verhalten des Preises in Form eines Oszillators. Gibt Signale für die Eröffnung von Trades aus, wenn es eine Erholung von der Ober- und Untergrenze des Oszillators gibt. In Form eines Histogramms zeigt es die geglättete Stärke des Trends.  Ergänzt jede Handelsstrategie, vom Scalping bis zum Intraday.  Der Indikator wird nicht neu gezeichnet.  Geeignet für den Einsatz auf allen Symbolen/Instrumenten.  
    PZ Harmonacci Patterns
    PZ TRADING SLU
    3.43 (7)
    Dies ist wahrscheinlich der vollständigste Indikator für die automatische Erkennung der harmonischen Preisbildung, den Sie für die MetaTrader-Plattform finden können. Es erkennt 19 verschiedene Muster, nimmt Fibonacci-Projektionen genauso ernst wie Sie, zeigt die potenzielle Umkehrzone (PRZ) an und findet geeignete Stop-Loss- und Take-Profit-Werte. [ Installationsanleitung | Update-Anleitung | Fehlerbehebung | FAQ | Alle Produkte ] Es erkennt 19 verschiedene harmonische Preisbildungen Dar
    Full Forex Market View Dashboard
    Opengates Success International
    5 (2)
    VOLLSTÄNDIGE FOREX-MARKTANSICHT Dashboard-Anzeige Dies ist ein benutzerdefinierter Indikator, der erstellt wurde, um Händlern einen vollständigen Überblick darüber zu geben, was auf dem Markt vor sich geht. Es verwendet Echtzeitdaten, um auf den Markt zuzugreifen und alle Informationen anzuzeigen, die für einen erfolgreichen Handel erforderlich sind. INSTALLATION: Bevor Sie diesen Indikator an Ihren Fenster-Chart anhängen, gehen Sie zum Market Watch Panel Ihres MT4 und AUSBLENDEN Sie al
    Gann Signal
    Kirill Borovskii
    Gann Signal is a very simple indicator at first glance, but hidden inside is many years of experience in studying W.D.Ganna methods. The indicator gives accurate BUY/SELL signals, without redrawing. The indicator is very easy to use. All you need to do is attach it to your chart and follow its recommendations. The indicator constantly analyzes the market for entry opportunities. When such an opportunity appears, the indicator gives a signal in the form of an arrow. I repeat, all signals are NOT
    The Nihilist 5.0 Indicator includes Forexalien and Nihilist Easy Trend trading strategies and systems. It is composed of an MTF Dashboard where you can analyze the different input possibilities of each strategy at a glance. It has an alert system with different types of configurable filters. You can also configure which TF you want to be notified on your Metatrader 4 platform and Mobile application The indicator has the option to view how could be a TP and SL by using ATR or fixed points, even
    Connect Indicator
    Sukunthakan Ngernbamrung
    Connect Indicator is a tool used for connecting indicators between the MQL market and MT4. The connected indicators are made by our group and can be used for other applications, such as sending messages to the Line application or Telegram application. If you have any questions, please don't hesitate to ask us to receive support. Function and indicator buffer Buffer one is the high price of the previous candle. Buffer two is the high price of the previous candle. Usage To connect indicators to fu
    A. Was ist A2SR ?   * Es ist ein führender technischer Indikator (kein Repaint, kein Verzögern). -- Orientierungshilfe : -- unter  https://www.mql5.com/en/blogs/post/734748/page4#comment_16532516 -- und  https://www.mql5.com/en/users/yohana/blog A2SR verfügt über eine spezielle Technik zur Bestimmung der Unterstützungsniveaus (Nachfrage) und des Widerstands (Angebot). Im Gegensatz zu der gewöhnlichen Methode, die wir im Internet gesehen haben, hat A2SR ein originelles Konzept zur Bestimmung d
    Moving pivot Average Fibonacci The  indicator compares the selected period with its counterpart from the previous period. The indicator determines the moving Fibonacci levels for the day or any time interval to assess the price movement range from the time average. The indicator helps predict the expected high or low for the day based on historical time data. The pivot line can be considered an average trend line and use it in a variety of trading strategies. If you have any question about t
    Currently Price 20% OFF ( for unlimited use )   BONUS  AUX VIP Club 2024 : Include  EA Airbag  and  Load Data History  to enhance the performance of this tool to its maximum potential  Click Here to Download Files   ( for users only )   Hello World! Introducing.. SMCpro VIP tool and Indicator for MetaTrader 4, designed to revolutionize your trading experience with the ICT Smart Money Concept. This system is meticulously crafted to empower traders with advanced insights and precision in
    Full STO
    Roman Smoroda
    Vollständiger STO-Indikator (enthält alle Versionen der drei STO-Indikatoren: Premium, Gold, Silver) - STABLE TRADE OPTION ist für den automatischen Handel mit binären Optionen konzipiert.  VORSICHTIG LESEN!!!!! WICHTIG Erstellen Sie in einem Terminal zwei Vorlagen mit unterschiedlichen Verfallzeiten, eine Vorlage für 18:01, 18:02 mit Verfallzeiten von 1 bis 15 Minuten und eine Vorlage für 22:00 mit Verfallzeiten von 10 bis 20 Minuten. Gewinnrate: 71% in den letzten 5 Jahren Geldverwalt
    Weitere Produkte dieses Autors
    PZ Day Trading
    PZ TRADING SLU
    3.67 (3)
    Dieser Indikator erkennt Preisumkehrungen im Zick-Zack, wobei nur Preisaktionsanalysen und ein Donchian-Kanal verwendet werden. Es wurde speziell für den kurzfristigen Handel entwickelt, ohne dass ein Nachlackieren oder ein Backpainting erforderlich ist. Es ist ein fantastisches Werkzeug für clevere Trader, die darauf abzielen, das Timing ihrer Operationen zu verbessern. [ Installationsanleitung | Update-Anleitung | Fehlerbehebung | FAQ | Alle Produkte ] Erstaunlich einfach zu handeln Es bi
    Dies ist wahrscheinlich der vollständigste Indikator für die automatische Erkennung der harmonischen Preisbildung, den Sie für die MetaTrader-Plattform finden können. Es erkennt 19 verschiedene Muster, nimmt Fibonacci-Projektionen genauso ernst wie Sie, zeigt die potenzielle Umkehrzone (PRZ) an und findet geeignete Stop-Loss- und Take-Profit-Werte. [ Installationsanleitung | Update-Anleitung | Fehlerbehebung | FAQ | Alle Produkte ] Es erkennt 19 verschiedene harmonische Preisbildungen Dar
    PZ Trend Trading MT5
    PZ TRADING SLU
    3.67 (3)
    Trend Trading ist ein Indikator, der so weit wie möglich von den Markttrends profitiert, indem er Pullbacks und Breakouts zeitlich festlegt. Sie findet Handelsmöglichkeiten, indem sie analysiert, was der Preis während etablierter Trends tut. [ Installationsanleitung | Update-Anleitung | Fehlerbehebung | FAQ | Alle Produkte ] Handeln Sie mit Zuversicht und Effizienz an den Finanzmärkten Profitieren Sie von etablierten Trends, ohne ins Wanken zu geraten Profitable Pullbacks, Ausbrüche und vor
    Dieser Expertenberater implementiert das ursprüngliche Handelssystem von Dennis und Eckhardt, das allgemein als The Turtle Trader bekannt ist. Es handelt genau wie die ursprünglichen Turtles und kann von erfahrenen Tradern verwendet werden, um Trends in auf- oder absteigenden Märkten zu erfassen. [ Installationsanleitung | Update-Anleitung | Fehlerbehebung | FAQ | Alle Produkte ] Einfach zu bedienen und zu überwachen Vollständig konfigurierbare Strategieeinstellungen Voll konfigurierbare Handel
    PZ Swing Trading MT5
    PZ TRADING SLU
    5 (4)
    Swing Trading ist der erste Indikator, der Schwankungen in Trendrichtung und mögliche Umkehrschwankungen erkennt. Es wird der in der Handelsliteratur weit verbreitete Baseline-Swing-Trading-Ansatz verwendet. Der Indikator untersucht mehrere Preis- und Zeitvektoren, um die aggregierte Trendrichtung zu verfolgen und erkennt Situationen, in denen der Markt überverkauft oder überkauft ist und zur Korrektur bereit ist. [ Installationsanleitung | Update-Anleitung | Fehlerbehebung | FAQ | Alle Produkte
    PZ Trend Trading
    PZ TRADING SLU
    4.8 (5)
    Trend Trading ist ein Indikator, der so weit wie möglich von den Markttrends profitiert, indem er Pullbacks und Breakouts zeitlich festlegt. Sie findet Handelsmöglichkeiten, indem sie analysiert, was der Preis während etablierter Trends tut. [ Installationsanleitung | Update-Anleitung | Fehlerbehebung | FAQ | Alle Produkte ] Handeln Sie mit Zuversicht und Effizienz an den Finanzmärkten Profitieren Sie von etablierten Trends, ohne ins Wanken zu geraten Profitable Pullbacks, Ausbrüche und vor
    PZ Day Trading MT5
    PZ TRADING SLU
    2.83 (6)
    Dieser Indikator erkennt Preisumkehrungen im Zick-Zack, wobei nur Preisaktionsanalysen und ein Donchian-Kanal verwendet werden. Es wurde speziell für den kurzfristigen Handel entwickelt, ohne dass ein Nachlackieren oder ein Backpainting erforderlich ist. Es ist ein fantastisches Werkzeug für clevere Trader, die darauf abzielen, das Timing ihrer Operationen zu verbessern. [ Installationsanleitung | Update-Anleitung | Fehlerbehebung | FAQ | Alle Produkte ] Erstaunlich einfach zu handeln Es bi
    Sind Sie es leid, Unterstützungs- und Widerstandslinien zu zeichnen? Der Unterstützungswiderstand ist ein Multi-Zeitrahmen-Indikator, der Unterstützungs- und Widerstandslinien mit einer sehr interessanten Wendung automatisch erkennt und zeichnet: Wenn das Preisniveau im Laufe der Zeit getestet wird und seine Bedeutung zunimmt, werden die Linien dicker und dunkler. [ Installationsanleitung | Update-Anleitung | Fehlerbehebung | FAQ | Alle Produkte ] Steigern Sie Ihre technische Analyse über Nacht
    PZ Goldfinch Scalper EA MT5
    PZ TRADING SLU
    3.71 (48)
    Dies ist die neueste Iteration meines berühmten Scalpers Goldfinch EA, der vor fast einem Jahrzehnt zum ersten Mal veröffentlicht wurde. Sie lenkt den Blick auf plötzliche Volatilitätsausweitungen, die in kurzen Zeiträumen stattfinden: Sie geht davon aus, dass die Trägheit der Preisbewegung nach einer plötzlichen Preisbeschleunigung ausgenutzt wird, und versucht, sie zu nutzen. Diese neue Version wurde vereinfacht, damit der Händler die Optimierungsfunktion des Testers leicht nutzen kann, um die
    FREE
    PZ Reversal Fractals MT5
    PZ TRADING SLU
    4.46 (37)
    This is the latest iteration of my famous indicator, Reversal Fractals, published for the first time almost a decade ago. It examines the price structure of fractals to determine possible reversal points in the market, providing timing to positional traders that already have a fundamental or technical valuation model. [ Installation Guide | Update Guide | Troubleshooting | FAQ | All Products ] Reversal fractals can start long trends The indicator is non repainting It implements alerts of all k
    FREE
    PZ Market Depth
    PZ TRADING SLU
    5 (1)
    Do you like scalping? Th is indicator displays information about the latest price quotes received from the broker. [ Installation Guide | Update Guide | Troubleshooting | FAQ | All Products ] Identify tick trends easily A blue row means the price has increased A red row means the price has decreased Customizable colors and font sizes Display your desired amount of rows The indicator is non-repainting Parameters Rows: amount of rows with data to display in the chart Font size: font size of th
    PZ Goldfinch Scalper EA
    PZ TRADING SLU
    2.61 (46)
    Dies ist die neueste Iteration meines berühmten Scalpers Goldfinch EA, der vor fast einem Jahrzehnt zum ersten Mal veröffentlicht wurde. Sie lenkt den Blick auf plötzliche Volatilitätsausweitungen, die in kurzen Zeiträumen stattfinden: Sie geht davon aus, dass die Trägheit der Preisbewegung nach einer plötzlichen Preisbeschleunigung ausgenutzt wird, und versucht, sie zu nutzen. Diese neue Version wurde vereinfacht, damit der Händler die Optimierungsfunktion des Testers leicht nutzen kann, um die
    FREE
    PZ Pivot Points MT5
    PZ TRADING SLU
    4.95 (22)
    This indicator displays pivot points in the chart, including historical vales, and supports many calculation modes for Pivot Points and S/R levels. [ Installation Guide | Update Guide | Troubleshooting | FAQ | All Products ] It plots historical levels for backtesting purposes It allows you to select the reference timeframe It implements different Pivot Point calculation modes It implements different SR calculation modes It implements customizable colors and sizes Calculation Modes The indi
    FREE
    PZ Trendlines MT5
    PZ TRADING SLU
    4.67 (6)
    Tired of plotting trendlines? The PZ TrendLines MT5 indicator applies a mechanical approach to the construction of trend lines for you!  [ Installation Guide | Update Guide | Troubleshooting | FAQ | All Products ] It can draw up to 18 trendlines Trendlines can be optionally based on fractals Each line represents a breakout level Each trendline can be broken or rejected Configurable amount of lines Configurable colors Support I am happy to provide free products but given my limited time, they com
    FREE
    PZ Inside Bars MT5
    PZ TRADING SLU
    4.54 (13)
    This indicator detects inside bars of several ranges, making it very easy for price action traders to spot and act on inside bar breakouts. [ Installation Guide | Update Guide | Troubleshooting | FAQ | All Products ] Easy to use and understand Customizable color selections The indicator implements visual/mail/push/sound alerts The indicator does not repaint or backpaint An inside bar is a bar or series of bars which is/are completely contained within the range of the preceding bar. A blue box is
    FREE
    PZ Harmonacci Patterns
    PZ TRADING SLU
    3.43 (7)
    Dies ist wahrscheinlich der vollständigste Indikator für die automatische Erkennung der harmonischen Preisbildung, den Sie für die MetaTrader-Plattform finden können. Es erkennt 19 verschiedene Muster, nimmt Fibonacci-Projektionen genauso ernst wie Sie, zeigt die potenzielle Umkehrzone (PRZ) an und findet geeignete Stop-Loss- und Take-Profit-Werte. [ Installationsanleitung | Update-Anleitung | Fehlerbehebung | FAQ | Alle Produkte ] Es erkennt 19 verschiedene harmonische Preisbildungen Dar
    PZ Binary Options MT5
    PZ TRADING SLU
    4.07 (14)
    This indicator analyzes price action patterns and helps you to make positive equity decisions in the binary options market. [ Installation Guide | Update Guide | Troubleshooting | FAQ | All Products ] Easy to trade Trade both call and put options No crystal ball and no predictions The indicator is non-repainting The only strategy suitable for binary options is applying a mathematical approach, like professional gamblers do. It is based on the following principles: Every binary option represents
    FREE
    PZ Turtle Trading MT5
    PZ TRADING SLU
    4.5 (8)
    The Turtle Trading Indicator implements the original Dennis Richards and Bill Eckhart trading system, commonly known as The Turtle Trader. This trend following system relies on breakouts of historical highs and lows to take and close trades: it is the complete opposite to the "buy low and sell high" approach. The main rule is "Trade an N-day breakout and take profits when an M-day high or low is breached (N must me above M)".  [ Installation Guide | Update Guide | Troubleshooting | FAQ | All Pr
    FREE
    Wolfe Waves sind natürlich vorkommende Handelsmuster, die an allen Finanzmärkten vorhanden sind und einen Kampf um einen Gleichgewichtspreis darstellen. Diese Muster können sich über kurze und lange Zeiträume entwickeln und sind eines der zuverlässigsten prädiktiven Umkehrmuster, die es gibt und die normalerweise starken und langen Kursbewegungen vorausgehen. [ Installationsanleitung | Update-Anleitung | Fehlerbehebung | FAQ | Alle Produkte ] Klare Handelssignale Erstaunlich einfach zu handeln
    PZ Binary Options
    PZ TRADING SLU
    4 (2)
    This indicator analyzes price action patterns and helps you to make positive equity decisions in the binary options market. [ Installation Guide | Update Guide | Troubleshooting | FAQ | All Products ] Easy to trade Trade both call and put options No crystal ball and no predictions The indicator is non-repainting The only strategy suitable for binary options is applying a mathematical approach, like professional gamblers do. It is based on the following principles: Every binary option represents
    FREE
    PZ Swing Trading
    PZ TRADING SLU
    5 (4)
    Swing Trading ist der erste Indikator, der Schwankungen in Trendrichtung und mögliche Umkehrschwankungen erkennt. Es wird der in der Handelsliteratur weit verbreitete Baseline-Swing-Trading-Ansatz verwendet. Der Indikator untersucht mehrere Preis- und Zeitvektoren, um die aggregierte Trendrichtung zu verfolgen und erkennt Situationen, in denen der Markt überverkauft oder überkauft ist und zur Korrektur bereit ist. [ Installationsanleitung | Update-Anleitung | Fehlerbehebung | FAQ | Alle Produkte
    PZ Sandwich Bars MT5
    PZ TRADING SLU
    5 (2)
    This indicator detects Sandwich Bars of several ranges, an extremely reliable breakout pattern. A sandwich setup consists on a single bar that engulfs several past bars, breaking and rejecting the complete price range. [ Installation Guide | Update Guide | Troubleshooting | FAQ | All Products ] Easy and effective usage Customizable bar ranges Customizable color selections The indicator implements visual/mail/push/sound alerts The indicator does not repaint or backpaint The indicator could not b
    FREE
    PZ Oscillator MT5
    PZ TRADING SLU
    3.8 (10)
    This is a smooth and responsive accelerometer which reveals the market trend and strength. [ Installation Guide | Update Guide | Troubleshooting | FAQ | All Products ] Two moving averages indicate trend direction The histogram represents strength of the price movement It draws buy and sell zones as colored vertical lines Should be used as a confirmation indicator Customizable line widths and colors It implements alerts of all kinds This indicator is similar to MACD but aims to react faster t
    FREE
    PZ Trendlines
    PZ TRADING SLU
    4.64 (11)
    Tired of plotting trendlines? The PZ TrendLines indicator applies a mechanical approach to the construction of trend lines for you!  [ Installation Guide | Update Guide | Troubleshooting | FAQ | All Products ] It can draw up to 18 trendlines Trendlines can be optionally based on fractals Each line represents a breakout level Each trendline can be broken or rejected Configurable amount of lines Configurable colors Support I am happy to provide free products but given my limited time, they come
    FREE
    Dieser Indikator erkennt über 30 japanische Candlestick-Muster und hebt sie wunderschön auf der Karte hervor. Es ist einfach einer dieser Indikatoren, auf die Preisaktionshändler nicht verzichten können. Steigern Sie Ihre technische Analyse über Nacht Erkennen Sie leicht japanische Kerzenmuster Handeln Sie zuverlässig und mit universellen Umkehrmustern Springen Sie mithilfe von Fortsetzungsmustern sicher auf etablierte Trends Der Indikator ist nicht neu lackiert und implementiert Warnungen Der
    PZ Turtle Trading
    PZ TRADING SLU
    3.77 (13)
    The Turtle Trading Indicator implements the original Dennis Richards and Bill Eckhart trading system, commonly known as The Turtle Trader. This trend following system relies on breakouts of historical highs and lows to take and close trades: it is the complete opposite to the "buy low and sell high" approach. The main rule is "Trade an N-day breakout and take profits when an M-day high or low is breached (N must me above M)". [ Installation Guide | Update Guide | Troubleshooting | FAQ | All Prod
    FREE
    PZ Wolfe Waves
    PZ TRADING SLU
    1 (1)
    Wolfe Waves sind natürlich vorkommende Handelsmuster, die an allen Finanzmärkten vorhanden sind und einen Kampf um einen Gleichgewichtspreis darstellen. Diese Muster können sich über kurze und lange Zeiträume entwickeln und sind eines der zuverlässigsten prädiktiven Umkehrmuster, die es gibt und die normalerweise starken und langen Kursbewegungen vorausgehen. [ Installationsanleitung | Update-Anleitung | Fehlerbehebung | FAQ | Alle Produkte ] Klare Handelssignale Erstaunlich einfach zu handeln
    PZ Market Profile
    PZ TRADING SLU
    3.91 (11)
    The market profile indicator provides with an X-Ray vision into market activity, outlining the most important price levels, value area and control value of the daily trading session. [ Installation Guide | Update Guide | Troubleshooting | FAQ | All Products ] Easy to understand and use Understand market dynamics easily Automatic timeframe selection Identify zones of trading value and discard others It is useful in all market conditions Effective for any trading strategy It implements three color
    FREE
    PZ Lopez Flow MT5
    PZ TRADING SLU
    4.5 (4)
    This indicator studies price action as an aggregation of price and time vectors, and uses the average vector to determine the direction and strength of the market. This indicator highlights the short-term directionality and strength of the market, and can be used to capitalize from short-term price movements by trading breakouts or binary options.  [ Installation Guide | Update Guide | Troubleshooting | FAQ | All Products ] Find market direction easily Confirm with breakouts or other indicators
    FREE
    This indicator evaluates the market sentiment using raw price action measurements, and it is an amazing trading confirmation. It can be used to take a trend-trade approach or a contrarian approach using reversal patterns. [ Installation Guide | Update Guide | Troubleshooting | FAQ | All Products ] Find early reversals Confirm short-term trades Detect indecision on the market Take contrarian trades near support and resistance levels Trade inside bars confirmed by overall direction of the market T
    FREE
    Auswahl:
    Frank Paetsch
    7067
    Frank Paetsch 2024.03.22 11:08 
     

    Thank you

    fx_20200225
    40
    fx_20200225 2023.01.09 16:13 
     

    Repainting signals (arrow), not recommended

    PZ TRADING SLU
    791249
    Antwort vom Entwickler Arturo Lopez Perez 2023.03.03 12:46
    To avoid the moving average from recalculating, use a MA shift of 1 or a price applied = Open Price. Thanks.
    ABCD
    241
    ABCD 2022.04.27 23:42 
     

    See Comments #1 and #3.

    Antwort auf eine Rezension
    Version 3.0 2024.07.19
    Housekeeping update
    Version 2.5 2022.04.25
    - Trend fix
    Version 2.4 2022.04.21
    - Improved exit for losing trades