Draw and Sync Objects MT4
- Indikatoren
- Nguyen Thanh Sang
- Version: 2.10
- Aktualisiert: 19 März 2022
Draw and Sync Objects Multiple Charts
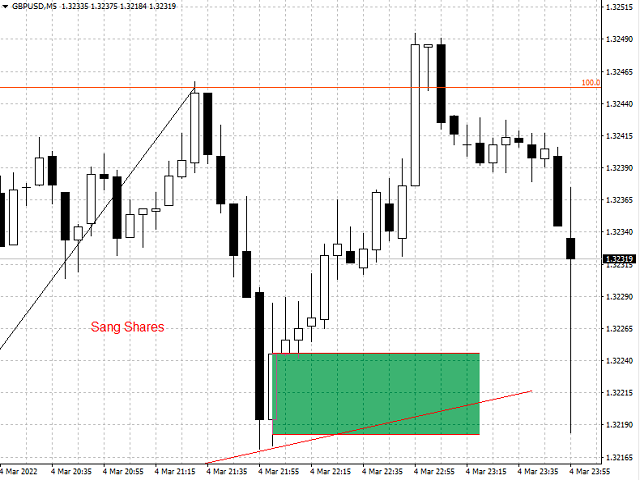
1. Draw objects by key press. (You must: 1. Press Function key => 2. Click where you want to draw => 3. Draw it => 4. Press ESC to complete).
(If you don't want to draw after pressing function key, you must press ESC to cancel).
2. Developing : Sync selected objects to multiple charts by button.
3. Developing: Hide objects that do not belong to the current symbol (Objects drawn with this indicator will belong to the symbol they are plotted on. When your chart changes to a different symbol, they will be in progress. hidden).
Function list of keys:
Ctrl + Shift: draw Rectangle.
D: draw Trend Line.
T: draw Text.
F: draw Fibonacci Retracement
S: Toggle Scale Fix.
Q: Zoom In.
W: Zoom Out.
Version 1.10: When the rectangle has been deleted, the lines of rectangle will be deleted.
Version 1.20: When the rectangle drawn by indicator has been changed, the lines of it will be changed.
Version 1.30: Add function to key U for extend all Rectangles drawn by this indicator to last bar.
Version 1.40: Add 5 colors input for select the color rectangle after creating it.
Version 1.50:
- Hide objects belong other symbols have been drawn by this indicator.
- Sync selected objects when you click Sync Objects button:
+ Enable sync button in input.
+ Set indexes of chart you want to sync (First chart index is 1. Next chart index is 2, ...)
Version 1.60:
- Add 5 charts to sync objects (now 10 charts).
- Fix: chart has same index with current chart will be ignored when you sync objects.
- Press U key: now extends rectangles to last bar + 1 (if hourly chart, it will be extended to next hour).
- Fix: sync fill color of rectangle.
Version 1.70: fix sync lines of rectangles
Version 1.80: add some colors and remove fill color buttons when you click rectangles.
Version 1.90: add some input to edit sync objects button properties.
Version 2.0:
- Add 5 charts to sync objects (total: 20 charts).
- ESC Key: deselect all objects.
- G Key: enable select rectangles by clicking their fill (you need press G whenever you want to select rectangle by clicking its fill, one click one rectangle and disable by click anywhere on chart).
- E Key: show colors buttons, remove BG fill button, delete rectangle button, mark new name button for rectangle.
+ Delete rectangle button: when you click it, rectangle will be deleted and the chart shows you a button to sync deleting rectangle. That button named "Sync Rectangle" (the rectangles of other sync charts will be deleted when you click this button).
+ Mark new name button: when you don't want to sync a rectangle, you can mark it as new. This indicator will understand it is a new rectangle. And it will not be synchronized with old rectangles in other charts. (You can click sync objects button with this new rectangle, other charts will create new rectangles).
Version 2.10: add key inputs to draw rectangle, trendline, text and fibonacci retracement.



















Great! Well done!!! Is it possible to add alerts when the price enters the rectangle? It would be perfect!!! and if you want to exaggerate, the possibility of changing between 2 template.