• Übersicht
  • Bewertungen (2)
  • Diskussion (4)
  • Neue Funktionen

Regressor

1

Dynamischer Kanal. Die Kanalbreite ändert sich automatisch in Abhängigkeit von der Preisbewegung. Je stärker die Abweichung von der Mitte des Kanals ist, desto breiter werden die Grenzen. Der Indikator passt sich an die Bewegungen an dem von ihnen festgelegten Teil des Diagramms an (Parameter "Bars for calculations"). Dementsprechend, wenn der Preis in einem bestimmten Intervall einen starken Schwung gemacht hat, wird sich der Kanal erweitern und auf weitere starke Schwankungen warten. Das heißt, seine Parameter werden immer der aktuellen Marktsituation entsprechen.

Der Kanal ist nicht für die Analyse historischer Daten gedacht! Um die Funktion zu testen, führen Sie sie im Tester aus!

Der Kanal dehnt sich je nach vorherigen Bewegungen sowohl aus als auch verengt sich. Diese Bewegungen hängen vom Parameter "Bars for calculations" ab. Wenn Sie "Bars for calculations"=200 einstellen, passt sich der Kanal an die Bewegungen der letzten 200 Balken an. Die oberen und unteren Grenzen des Kanals werden sich je nach der größten Abweichung der vorherigen Bewegungen für den "period" nähern oder distanzieren. Je stärker der Preis zuvor von der Mittellinie abweichte, desto breiter wird der Kanal, und bei ruhiger Bewegung verengt sich der Kanal. Gleichzeitig ist das Wesen des Kanals gleich geblieben - die Grenzen durchschnittlich Abweichungen von der Mittellinie (TSF), aber die Durchschnittsgeschwindigkeit hängt von der Geschwindigkeit der Preisänderung ab. Je schneller sich der Preis der Kanalgrenze nähert, desto schneller expandiert er.

Sie können es als normalen Kanal verwenden, ohne automatisch zu erweitern. Setzen Sie dazu den Parameter "Speed" auf "Fixed" und stellen Sie die Kanalbreite manuell mit dem Parameter "Width Channel" ein.
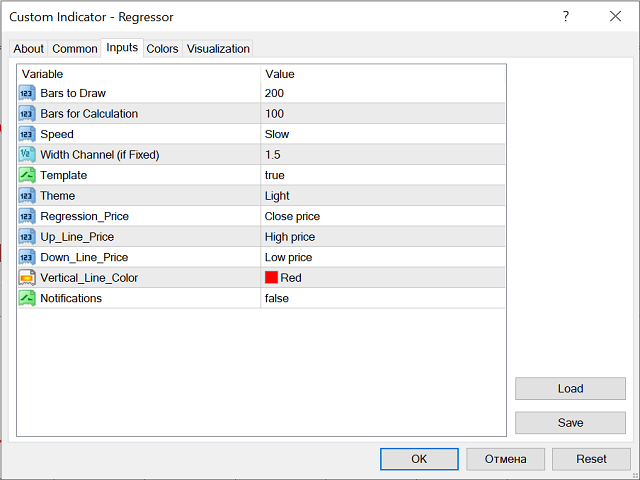
Daten: 

"Bars to Draw" - Die Anzahl der Verlaufsstäbe, die der Indikator anzeigen soll. Sie können die Anzahl der Balken zum Rendern des Kanals reduzieren, um das Diagrammfenster nicht zu überladen. "Bars to Draw" muss zweimal größer als "Period" sein. Dies trägt auch dazu bei, die CPU-Auslastung zu reduzieren.

"Bars for calculations" - die Anzahl der Balken für die Kanalberechnung. Dieser Parameter gibt die Tiefe für die Analyse historischer Daten an. Die maximale Anzahl von Bars beträgt 400. Es ist dieser Abschnitt, der die Breite des Kanals bestimmt. Zur Veranschaulichung ist die Mittellinie abgetönt und der Anfang ist mit einer vertikalen Linie markiert. Bei Kontakt mit dem Preis werden auch die Grenzen auf dieser Seite abgetönt. Um den Betrieb des Indikators in Echtzeit zu überprüfen, führen Sie ihn im Tester aus!

"Speed" - Der Parameter bestimmt die Geschwindigkeit, mit der sich die Kanalbreite ändert. Es gibt 4 Optionen:

  1. "Fixed" - Die Kanalgrenzen passen sich nicht an die Bewegungen an, sondern werden auf eine festgelegte Breite festgelegt. Sie können die Kanalbreite mit dem Parameter "Width Channel" festlegen
  2. "Slow" ist langsam. Wenn es in einem bestimmten Bereich des Zeitplans eine plötzliche Bewegung gab und dann sofort eine ruhige Bewegung begann, werden sich die Kanalgrenzen nach der Erweiterung langsam verengen. Das Gleiche gilt, wenn eine plötzliche Bewegung begonnen hat, dann werden sich die Grenzen langsam ausdehnen.
  3. "Medium" ist mittel.
  4. "Fast" ist schnell.

"Width Channel (if Fixed)" - Wenn "Fixed" aktiviert ist, können Sie die Breite des Kanals manuell festlegen. Änderungsschritt von 0.01

"Template" - Option, um die Vorlage für das Diagramm zu aktivieren oder zu deaktivieren.

"Theme" ist dunkel oder hell.

"Regression_Price", "Up_Line_Price", "Down_Line_Price" - Berechnung von Linien können in den Parametern geändert: PRICE_CLOSE, PRICE_OPEN, PRICE_HIGH, PRICE_LOW, PRICE_MEDIAN, PRICE_TYPICAL, PRICE_WEIGHTED.

"Vertical_Line_Color" - Die Farbe der Linie, die die Anzahl der zu berechnenden Balken begrenzt. Kann farbloses clrNONE machen.

"Notifications" ist eine Funktion zum Senden von Nachrichten an ein mobiles Terminal. Geben Sie dazu Ihre mobile Terminal-ID in den Einstellungen "Benachrichtigungen" im Terminal mit dem eingestellten Indikator ein.

Die erste Kopie für 100 $, dann wird der Preis erhöht.


    Empfohlene Produkte
    Free automatic Fibonacci is an indicator that automatically plots a Fibonacci retracement based on the number of bars you select on the BarsToScan setting in the indicator. The Fibonacci is automatically updated in real time as new highest and lowest values appears amongst the selected bars. You can select which level values to be displayed in the indicator settings. You can also select the color of the levels thus enabling the trader to be able to attach the indicator several times with differe
    FREE
    TrendPlus
    Sivakumar Subbaiya
    4.08 (12)
    Trend Plus   Trendplus  Indicator   Time Frame: Suitable for any time frame.  Purpose: Trend Prediction. Blue and red candle indicate the buy and sell call respectively. Buy: When the blue candle is formed buy call is initiated. close the buy trades when the next red candle will formed.   Sell: When the Red candle is formed Sell call is initiated. close the Sell trades when the next blue candle will formed.   Happy trade!!
    FREE
    OrderBlock TS Roman
    Vladislav Vlastovskii
    3.8 (5)
    Индикатор строит блоки заказов (БЗ) по торговой системе (ТС) Романа. Поиск блоков осуществляется одновременно на двух таймфремах: текущем и старшем (определяемым в настройках). Для оптимизации и игнорирования устаревших блоков в настройках задается ограничение количества дней в пределах которых осуществляется поиск блоков. Блоки строятся по правилам ТС состоящем из трех шагов: какую свечу вынесли (что?); какой свечой вынесли (чем?); правило отрисовки (как?).
    FREE
    KeltnerChannelIndicator
    Todd Terence Bates
    5 (1)
    The Keltner Channel is a volatility-based technical indicator composed of three separate lines. The middle line is an exponential moving average (EMA) of the price. Additional lines are placed above and below the EMA. The upper band is typically set two times the Average True Range (ATR) above the EMA, and the lower band is typically set two times the ATR below the EMA. The bands expand and contract as volatility (measured by ATR) expands and contracts. Since most price action will be encompasse
    FREE
    Follow The Line
    Oliver Gideon Amofa Appiah
    4.07 (14)
    FOLLOW THE LINE GET THE FULL VERSION HERE: https://www.mql5.com/en/market/product/36024 This indicator obeys the popular maxim that: "THE TREND IS YOUR FRIEND" It paints a GREEN line for BUY and also paints a RED line for SELL.  It gives alarms and alerts of all kinds. IT DOES NOT REPAINT and can be used for all currency pairs and timeframes. Yes, as easy and simple as that. Even a newbie can use it to make great and reliable trades. NB: For best results, get my other premium indicators for more
    FREE
    Donchian channels are a tool in technical analysis used to determine the relative volatility of a market and the potential for price breakouts. Can help identify potential breakouts and reversals in price, which are the moments when traders are called on to make strategic decisions. These strategies can help you capitalize on price trends while having pre-defined entry and exit points to secure gains or limit losses. Using the Donchian channel can thus be part of a disciplined approach to manag
    FREE
    Wise Men Indicator demo
    Bohdan Kasyanenko
    3 (2)
    The indicator displays signals according to the strategy of Bill Williams on the chart. Demo version of the indicator has the same features as the paid, except that it can work only on a demo account . Signal "First Wise Man" is formed when there is a divergent bar with angulation.  Bullish divergent bar - with lower minimum and closing price in the upper half. Bearish divergent bar - higher maximum and the closing price at the bottom half. Angulation is formed when all three lines of Alligat
    FREE
    ZigZag Support Resistance MT4
    Emmanuel Tshepang Mosweu
    4 (1)
    This indicator uses the Zigzag indicator to identify swing highs and swing lows in the price chart.    Once it has identified the swing highs and swing lows, it can use them to determine potential support and resistance levels. A support level is formed when the price drops and bounces back up from a swing low, indicating that there is buying pressure at that level. A resistance level is formed when the price rises and reverses downward from a swing high, suggesting selling pressure at that leve
    FREE
    Wave Reversal Indicator - determines the direction of trend waves and price reversals. The indicator shows wave movements and trend directions. It gives recommendations where to follow the trader, helps to follow the trading strategy. It is an addition to an intraday or medium-term strategy. Almost all parameters are selected for each time frame and are changed automatically, the only parameter for manual adjustment is the wavelength. Works on various trading instruments and timeframes, rec
    FREE
    The indicator uses the Chester W. Keltner's channel calculation method, modified by the well-known trader Linda Raschke. Due to the modification, the calculated channel contains a much more complete overview of the price movements, which allows increasing the probability of an accurate prediction of the upcoming price movement. Unlike the classic Keltner method, the base line of the channel is plotted based on the Exponential Moving Average, and the Average True Range is used to calculate the up
    FREE
    UPD1 X00 Levels
    Vitaliy Kuznetsov
    5 (8)
    Der Indikator zeigt   runde Level   auf dem Chart an. Sie werden auch   psychologische , Bank- oder Major Player Level genannt. Auf diesen Niveaus gibt es einen echten Kampf zwischen Bullen und Bären, die Anhäufung vieler Orders, was zu einer erhöhten Volatilität führt. Der Indikator passt sich   automatisch   an jedes Instrument und jeden Zeitrahmen an. Wenn das   Level 80   durchbrochen und dann getestet ist,   kaufen wir . Wenn   Level 20   durchbrochen und dann getestet wird,   verkaufen wi
    FREE
    Necessary for traders: tools and indicators Waves automatically calculate indicators, channel trend trading Perfect trend-wave automatic calculation channel calculation , MT4 Perfect trend-wave automatic calculation channel calculation , MT5 Local Trading copying Easy And Fast Copy , MT4 Easy And Fast Copy , MT5 Local Trading copying For DEMO Easy And Fast Copy , MT4 DEMO Easy And Fast Copy , MT5 DEMO The homeopathic indicator is also called the CCI indicator. The CCI indicator was propos
    FREE
    This is a regression tree indicator for MT4/MT5. This indicator classificate nodes on the time period so that the deviation becomes smaller, and displays regression line and channel for each node. It's free! Attached CartDemo.ex4 and CartDemo.ex5 is a Demo version and has the following limitations: Method is RandomForest only Maximum number of bars is 200 Maximum number of trees is 2 Maximum tree depth is 2 Calculated waste lines are shown Not display correlation coefficients Fu
    FREE
    Updates 9/12/2023 - If you are looking for the Spock EA, I don't sell it anymore. DM me for more info. 24/10/2023  -  Check out my other products. Starting to roll out some EAs & indicators based on this range. Currently there is no MT5 version. I am using MT4 myself. So I will spend my time mostly to develop more extensive stats for the Stats version and maybe even an EA. But I might  develop a MT5 version. All depends on the demand. Meaning, the more people request it, the bigger the
    FREE
    Peak Trough Analysis is the great tool to detect peaks and troughs in your chart. Peak Trough Analysis tool can use three different peaks and troughs detection algorithm. The three algorithm include the orignal Fractals Indicator by Bill Williams, the Modified Fractals indicator and ZigZag indicator. You can use this peak and trough analysis tool to detect the price pattern made up from Equilibrium Fractal-Wave process. For further usage, there are good guide line on how to use this peak trough
    FREE
    The Sextet
    Naim El Hajj
    4 (3)
    The Sextet  is an MT4 indicator that displays 6 levels of Moving Averages, where the second is the moving average of the first, the third of the second, and so on. It gives a signal when all the moving average levels align in order. Get a Free Sextet EA, and read discussions about using The Sextet Indicator on Forex Factory: The Sextet EA @ Forex Factory Check out the  The Sextet Scalper Pro  for a more elaborate scalping strategy also with  Free EA . Key Features: Is a Moving Average of a Movi
    FREE
    Defines extremes. This indicator consists of two parts. The first draws lines on the chart indicating low volatility in relative daily market activity. The second is responsible for determining the extremum and gives signals to buy or sell. This system is suitable for all instruments. It is recommended to use a timeframe from m15 to h4. Before using, you need to choose the settings for yourself. Configure lines deviation. Specify volatility coefficient. Advantages The indicator does not repaint
    FREE
    Gleitende Durchschnitte ändern sich unterwegs. Der Indikator wählt automatisch einen Zeitraum für die Berechnung der gleitenden Durchschnitte aus. Je gerichteter die Bewegung ist, desto größer ist die Mittelungsperiode. Wenn sich der Trend verlangsamt, nimmt die Periode der gleitenden Durchschnitte ab und sie werden schneller. Dies ermöglicht eine schnellere Reaktion auf eine Trendwende.  Der Indikator funktioniert gut in einem Trend oder an einem Trendumkehrpunkt. In der Seitenwand kann der
    FREE
    LyfUD指标专门 为黄金设计的趋势指标 ,也可以用于任何金融工具。用于及时反映多空力量,由U线和D线组成, 波动以0为中轴偏离运行, U线为快线D线为慢线。 LyfUD指标可以和 绝大多数策略结合使用 ,能够更加有效的把握风控。 U线和D线采用价格行为市场追踪算法,能及时反映市场方向, 可用在任意货币。 特性: 1. U线、D线在0轴上方,买入信号参考。 2. U线、D线 在0轴下方 ,卖出信号参考。 3. U线、D  线极限背离转向,行情可能出现反转。 4.  滞后性低,能及时反映趋势。 致力于结合其他指标,LyfUD和  均线、Pinbar  等搭配使用能迅速找到一些合理的关键位。 LyfUD只作为参考依据,其风险与作者无关。未经作者同意,禁止他售。
    FREE
    Are you tired of drawing trendlines every time you're analyzing charts? Or perhaps you would like more consistency in your technical analysis. Then this is for you. This indicator will draw trend lines automatically when dropped on a chart. How it works Works similar to standard deviation channel found on mt4 and mt5. It has 2 parameters: 1. Starting Bar 2. Number of bars for calculation The   starting bar   is the bar which drawing of the trend lines will begin, while the   number of bars for c
    FREE
    Extremum by trend
    Anton Iudakov
    5 (1)
    Looking for entry points along the local trend without repaint! Arrows indicate entry points. Based on classic indicators. The indicator is easy to use. Settings Наименование Описание Frequency factor Signal frequency. The less, the more often. This affects the quality. Recommendations Recommended for use on major currency pairs. Timeframe from m5, m15, m30 Subscribe to my telegram channel, where we discuss intraday trading, ideas, indicators, etc., a link in my profile contacts.
    FREE
    Extremum Reverse Bar
    Yurij Izyumov
    2.8 (5)
    This indicator has been created for finding the probable reversal points of the symbol price. A small candlestick reversal pattern is used it its operation in conjunction with a filter of extremums. The indicator is not redrawn! If the extremum filter is disabled, the indicator shows all points that have a pattern. If the extremum filter is enabled, the condition works – if the history Previous bars 1 candles back contains higher candles and they are farther than the Previous bars 2 candle, such
    FREE
    RSI Candle Signal
    Jonathan Destailleur
    4.5 (2)
    RSI Candle Signal Indicator will change bars’ color when set overbought or oversold levels reach. How to Use RSI Candle Signal Uptrend/Downtrends  - RSI may be used to detect trending markets. For example, the RSI may stay above the mid line 50 in an uptrend. Top and Buttoms  - RSI may help in identifying the tops around the overbought readings (usually above 70), and the bottoms around the oversold area (usually below 30). Divergence  - divergence occurs when RSI directional movement is not c
    FREE
    Trend arrow Indicator
    NGUYEN NGHIEM DUY
    3.33 (9)
    Trend arrow Indicator is an arrow Indicator used as an assistant tool for your trading strategy. The indicator analyzes the standard deviation of bar close for a given period and generates a buy or sell signals if the deviation increases. It good to combo with Martingale EA to follow Trend and Sellect Buy Only/Sell Only for EA work Semi-Automatic. You can use this  Indicator with any EAs in my Products.
    FREE
    VR Donchian
    Vladimir Pastushak
    4.85 (13)
    Der VR Donchian -Indikator ist eine verbesserte Version des Donchian-Kanals. Die Verbesserungen betrafen fast alle Funktionen des Kanals, der Hauptbetriebsalgorithmus und die Kanalkonstruktion blieben jedoch erhalten. Je nach aktuellem Trend wurde dem Ball-Indikator eine Änderung der Farbe der Niveaus hinzugefügt – dies zeigt dem Händler deutlich eine Trendänderung oder eine Seitwärtsbewegung an. Es wurde die Möglichkeit hinzugefügt, den Händler über den Ausbruch einer von zwei Kanalebenen per S
    FREE
    Stable Trend MA
    Yurij Izyumov
    5 (1)
    The indicator is based on a single Moving Average of a user-defined period. By analyzing the price movement of the price relative to this MA, and also by tracking all updates of the price Highs and Lows over the same period as the MA period, the indicator draws its own picture of the trend, avoiding the ever-breaking MA lines. Therefore, if the trend goes up, the line will also point upwards and will not change its direction even on small retracements, allowing to capture almost the entire trend
    FREE
    With this system you can spot high-probability trades in direction of strong trends. You can profit from stop hunt moves initiated by the smart money! Important Information How you can maximize the potential of the scanner, please read here: www.mql5.com/en/blogs/post/718109 Please read also the blog about the usage of the indicator: Professional Trading With Strong Momentum This FREE Version of the indicator works only on EURUSD and GBPUSD. The full version of the indicator can be found here:
    FREE
    RSI With Alert Relative strength index (RSI) indicator is a popular technical indicator in the family of oscillators. RSI oscillates between 0 and 100 and traders use it to spot overbought and oversold states in the market. Typically, a value above 70 means that the instrument is overbought and due to a retracement. A value below 30 means that the trading instrument is oversold. RSI indicator strategies This indicator allows you to get notifications when some conditions trigger. You c
    FREE
    Traditional MACD MT4
    Daniel Lewis
    4.59 (56)
    MACD indicator in MetaTrader 4/5 looks different than MACD does in most other charting software. That is because the MetaTrader 4/5 version of MACD displays the MACD line as a histogram when it is traditionally displayed as a line. Additionally, the MetaTrader 4/5 version computes the Signal line using an SMA, while according to MACD definition it is supposed to be an EMA. The MetaTrader 4/5 version also does not compute a true MACD Histogram (the difference between the MACD/Signal lines). This
    FREE
    MTF Stochastic and RSI
    Georgiy Gazaryan
    5 (2)
    A simple but effective helper that will allow you to track both global and local market trends. The indicator combines the work of two oscillators: Stochastic and RSI. Both indicators can be set to any timeframe. Advantages of Use Multitimeframe - you can adjust both indicators to the desired timeframes. To obtain the entry points, you can use the Elder's triple screen system. Highly customizable - you can configure not only the parameters of the indicators, but also their appearance (color an
    FREE
    Käufer dieses Produkts erwarben auch
    Gann Made Easy
    Oleg Rodin
    4.85 (82)
    Gann Made Easy ist ein professionelles und einfach zu bedienendes Forex-Handelssystem, das auf den besten Handelsprinzipien unter Verwendung der Theorie von Mr. basiert. W.D. Gann. Der Indikator liefert genaue KAUF- und VERKAUFSsignale, einschließlich Stop-Loss- und Take-Profit-Levels. Mit PUSH-Benachrichtigungen können Sie auch unterwegs handeln. Bitte kontaktieren Sie mich nach dem Kauf! Ich werde meine Handelstipps und tolle Bonusindikatoren kostenlos mit Ihnen teilen! Wahrscheinlich haben Si
    - Real price is 80$ - 40% Discount ( It is 49$ now ) Contact me for instruction, add group and any questions! Related Product:  Bitcoin Expert , Gold Expert Introduction The breakout and retest strategy is traded support and resistance levels. it involves price breaking through a previous level.  The break and retest strategy is designed to help traders do two main things, the first is to avoid false breakouts. Many false breakouts start with a candlestick that breaks out of a level but ends wi
    Atomic Analyst
    Issam Kassas
    5 (2)
    Zunächst einmal ist es erwähnenswert, dass dieser Handelsindikator nicht neu malt, nicht neu zeichnet und keine Verzögerung aufweist, was ihn sowohl für manuellen als auch für Roboterhandel ideal macht. Benutzerhandbuch: Einstellungen, Eingaben und Strategie. Der Atom-Analyst ist ein PA-Preisaktionsindikator, der die Stärke und das Momentum des Preises nutzt, um einen besseren Vorteil auf dem Markt zu finden. Ausgestattet mit fortschrittlichen Filtern, die helfen, Rauschen und falsche Signale z
    Scalper Inside PRO
    Alexey Minkov
    4.73 (56)
    An exclusive indicator that utilizes an innovative algorithm to swiftly and accurately determine the market trend. The indicator automatically calculates opening, closing, and profit levels, providing detailed trading statistics. With these features, you can choose the most appropriate trading instrument for the current market conditions. Additionally, you can easily integrate your own arrow indicators into Scalper Inside Pro to quickly evaluate their statistics and profitability. Scalper Inside
    Gold Stuff
    Vasiliy Strukov
    4.89 (239)
    Gold Stuff-Ein Trendindikator, der speziell für Gold entwickelt wurde, kann auch auf allen Finanzinstrumenten verwendet werden. Der Indikator wird nicht neu gezeichnet und verzögert sich nicht. Empfohlener Zeitrahmen H1. Nach diesem Indikator geschrieben EA Gold Stuff Berater, können Sie es in meinem Profil finden. WICHTIG! Kontaktieren Sie mich sofort nach dem Kauf, um Anweisungen und Bonus zu erhalten!   Sie können eine kostenlose Kopie unseres Strong Support- und Trendscanner-Indikators
    Derzeit 20% Rabatt! Die beste Lösung für jeden Neueinsteiger oder Expert Händler! Dieses Dashboard arbeitet mit 28 Währungspaaren. Es basiert auf 2 unserer Hauptindikatoren (Advanced Currency Strength 28 und Advanced Currency Impulse). Es bietet einen hervorragenden Überblick über den gesamten Forex-Markt. Es zeigt die Werte der Advanced Currency Strength, die Veränderungsrate der Währungen und die Signale für 28 Devisenpaare in allen (9) Zeitrahmen. Stellen Sie sich vor, wie sich Ihr Hande
    Enigmera
    Ivan Stefanov
    5 (3)
    ENIGMERA: Der Kern des Marktes https://www.enigmera.com Einführung Dieser Indikator und dieses Handelssystem sind ein bemerkenswerter Ansatz für die Finanzmärkte. ENIGMERA nutzt die fraktalen Zyklen zur genauen Berechnung von Unterstützungs- und Widerstandsniveaus. Er zeigt die echte Akkumulationsphase an und gibt Richtung und Ziele vor.  Ein System, das funktioniert, egal ob wir uns in einem Trend oder in einer Korrektur befinden.  Wie funktioniert es? ENIGMERA besteht aus drei Linien: der
    TPSproTREND PrO
    Roman Podpora
    4.79 (19)
    TPSpro TREND PRO   ist ein Trendindikator, der den Markt automatisch analysiert und Informationen über den Trend und jede seiner Änderungen liefert sowie Signale für den Einstieg in Geschäfte ohne Neuzeichnung gibt! Der Indikator verwendet jede Kerze und analysiert sie separat. bezieht sich auf verschiedene Impulse – Aufwärts- oder Abwärtsimpuls. Exakte Einstiegspunkte in Transaktionen für Währungen, Krypto, Metalle, Aktien, Indizes! Version MT5                   VOLLSTÄNDIGE BESCHREIBUNG DES
    Dynamic Forex28 Navigator – Das Forex-Handelstool der nächsten Generation AKTUELL 49 % RABATT. Dynamic Forex28 Navigator ist die Weiterentwicklung unserer seit langem beliebten Indikatoren und vereint die Leistung von drei in einem: Advanced Currency Strength28 Indicator (695 Bewertungen) + Advanced Currency IMPULSE mit ALERT (520 Bewertungen) + CS28 Combo Signals (Bonus) Details zum Indikator https://www.mql5.com/en/blogs/post/758844 Was bietet der Strength Indicator der nächsten Generation?
    Trend Punch
    Mohamed Hassan
    4.95 (19)
    This indicator is unstoppable when combined with our other indicator called  Support & Resistance . After purchase, send us a message and you will get it   for  FREE as a BONUS! Introducing Trend Punch , the revolutionary forex trend indicator that will transform the way you trade! Trend Punch is uniquely designed to provide precise buy and sell arrows during strong market trends, making your trading decisions clearer and more confident. Whether you're trading major currency pairs or exotic sym
    Trend Screener
    STE S.S.COMPANY
    4.8 (87)
    Trendindikator, bahnbrechende, einzigartige Lösung für Trendhandel und -filterung mit allen wichtigen Trendfunktionen in einem Tool! Es handelt sich um einen 100 % nicht neu zu malenden Multi-Timeframe- und Multi-Währungs-Indikator, der für alle Symbole/Instrumente verwendet werden kann: Forex, Rohstoffe, Kryptowährungen, Indizes und Aktien. ZEITLICH BEGRENZTES ANGEBOT: Der Support- und Resistance-Screener-Indikator ist für nur 50 $ und lebenslang verfügbar. (Ursprünglicher Preis 250 $) (Angebot
    FX Volume
    Daniel Stein
    4.58 (33)
    Erhalten Sie Ihr tägliches Marktupdate mit Details und Screenshots über unser Morning Briefing hier auf mql5 und auf Telegram ! FX Volume ist der ERSTE und EINZIGE Volumenindikator, der einen ECHTEN Einblick in die Marktstimmung aus Sicht eines Brokers bietet. Es bietet fantastische Einblicke in die Positionierung von institutionellen Marktteilnehmern, wie z.B. Brokern, auf dem Forex-Markt, viel schneller als COT-Berichte. Diese Informationen direkt auf Ihrem Chart zu sehen, ist der wahre Game
    TPSpro RFI Levels
    Roman Podpora
    4.82 (22)
    ANWEISUNGEN    Russland -    ENG    Die Empfehlung basiert auf dem Indikator -   TPSpro   TREND PRO -   Version MT5 Die wichtigsten Elemente in der Branche sind entweder in Zonen oder in der Fabrik enthalten, oder sie führen zu einer Lösung bei einem Kauf oder dem Verkauf eines anderen Instruments. Wenn viele Menschen ihre Rechte nicht auf dem Händlerkonto verschlüsseln, werden die Folgen nicht schnell genug sein. Ich habe es damit abgeschlossen, dass ich diese Folgen nun noch interpretieren un
    FX Power MT4 NG
    Daniel Stein
    5 (13)
    Erhalten Sie Ihr tägliches Marktupdate mit Details und Screenshots über unser Morning Briefing hier auf mql5 und auf Telegram ! FX Power MT4 NG ist die nächste Generation unseres langjährig sehr beliebten Währungsstärkemessers FX Power. Und was bietet dieser Stärkezähler der nächsten Generation? Alles, was Sie am ursprünglichen FX Power geliebt haben PLUS GOLD/XAU-Stärkeanalyse Noch präzisere Berechnungsergebnisse Individuell konfigurierbare Analysezeiträume Anpassbares Berechnungslimit für noc
    Zunächst einmal ist es wichtig zu betonen, dass dieses Handelstool ein Nicht-Repaint-, Nicht-Redraw- und Nicht-Verzögerungsindikator ist, was es ideal für professionelles Trading macht. Online-Kurs, Benutzerhandbuch und Demo. Der Smart Price Action Concepts Indikator ist ein sehr leistungsstarkes Werkzeug sowohl für neue als auch erfahrene Händler. Er vereint mehr als 20 nützliche Indikatoren in einem und kombiniert fortgeschrittene Handelsideen wie die Analyse des Inner Circle Traders und Stra
    Ultimate Gold Advisor für MetaTrader 4 Der Ultimate Gold Advisor ist ein fortschrittliches technologisches Werkzeug, das entwickelt wurde, um das Handelserlebnis auf MetaTrader 4 zu optimieren. Es wurde entwickelt, um den Bedürfnissen erfahrener Trader gerecht zu werden. Dieser Indikator kombiniert Präzision, anspruchsvolle Analysen und vielseitige Funktionalität, um informierte Handelsentscheidungen zu unterstützen. Ideal für den Goldhandel, aber auch auf eine Vielzahl von Vermögenswerten anwen
    Stratos Pali
    Michela Russo
    5 (1)
    Stratos Pali Indicator   is a revolutionary tool designed to enhance your trading strategy by accurately identifying market trends. This sophisticated indicator uses a unique algorithm to generate a complete histogram, which records when the trend is Long or Short. When a trend reversal occurs, an arrow appears, indicating the new direction of the trend. Important Information Revealed Leave a review and contact me via mql5 message to receive My Top 5 set files for Stratos Pali at no cost! D
    Legacy of Gann
    Pavel Zamoshnikov
    4.83 (12)
    The indicator very accurately determines the levels of the possible end of the trend and profit fixing. The method of determining levels is based on the ideas of W.D.Gann, using an algorithm developed by his follower Kirill Borovsky. Extremely high reliability of reaching levels (according to K. Borovsky  - 80-90%) Indispensable for any trading strategy – every trader needs to determine the exit point from the market! Precisely determines targets on any timeframes and any instruments (forex, met
    Gold Channel is a volatility-based indicator, developed with a specific timing algorithm for the XAUUSD pair, which consists of finding possible corrections in the market. This indicator shows two outer lines, an inner line (retracement line) and an arrow sign, where the theory of the channel is to help identify overbought and oversold conditions in the market. The market price will generally fall between the boundaries of the channel. If prices touch or move outside the channel it is a tra
    Currency Strength Wizard ist ein sehr leistungsstarker Indikator, der Ihnen eine Komplettlösung für erfolgreichen Handel bietet. Der Indikator berechnet die Stärke dieses oder jenes Forex-Paares anhand der Daten aller Währungen in mehreren Zeitrahmen. Diese Daten werden in Form von benutzerfreundlichen Währungsindizes und Währungsstärkelinien dargestellt, anhand derer Sie die Stärke dieser oder jener Währung erkennen können. Sie müssen lediglich den Indikator an das Diagramm anhängen, mit dem Si
    GOLD Impulse with Alert
    Bernhard Schweigert
    4.56 (9)
    Dieser Indikator ist eine hervorragende Kombination aus unseren 2 Produkten Advanced Currency IMPULSE with ALERT  +   Currency Strength Exotics . Es funktioniert für alle Zeitrahmen und zeigt grafisch Impulse der Stärke oder Schwäche für die 8 wichtigsten Währungen plus ein Symbol! Dieser Indikator ist darauf spezialisiert, die Beschleunigung der Währungsstärke für beliebige Symbole wie Gold, Exotische Paare, Rohstoffe, Indizes oder Futures anzuzeigen. Als erster seiner Art kann jedes Sym
    Scalper Vault
    Oleg Rodin
    5 (27)
    Scalper Vault ist ein professionelles Scalping-System, das Ihnen alles bietet, was Sie für erfolgreiches Scalping benötigen. Dieser Indikator ist ein komplettes Handelssystem, das von Forex- und Binäroptionshändlern verwendet werden kann. Der empfohlene Zeitrahmen ist M5. Das System liefert Ihnen genaue Pfeilsignale in Richtung des Trends. Es liefert Ihnen auch Top- und Bottom-Signale und Gann-Marktniveaus. Die Indikatoren bieten alle Arten von Warnungen, einschließlich PUSH-Benachrichtigungen.
    Market Structure
    Reza Aghajanpour
    4.85 (26)
    ** All Symbols x All Timeframes scan just by pressing scanner button ** *** Contact me  to send you instruction and add you in "Market Structure group" for sharing or seeing experiences with other users. Introduction: Market structure is important for both new and professional traders since it can influence the liquidity and price action of a market (Breakout and Retest). It’s also one of the most commonly used techniques to understand trends, identify potential reversal points, and get a feel f
    Matrix Arrow Indicator MT4
    Juvenille Emperor Limited
    5 (3)
    Matrix Arrow Indicator MT4 ist ein einzigartiger 10-in-1-Trend, der zu 100 % nicht neu gezeichnet werden kann. Multi-Timeframe-Indikator, der für alle Symbole/Instrumente verwendet werden kann: Forex, Rohstoffe, Kryptowährungen, Indizes, Aktien. Der Matrix Arrow Indicator MT4 wird den aktuellen Trend in seinen frühen Stadien bestimmen und Informationen und Daten von bis zu 10 Standardindikatoren sammeln, die sind: Durchschnittlicher Richtungsbewegungsindex (ADX) Rohstoffkanalindex (CCI) Klassis
    IX Power MT4
    Daniel Stein
    5 (5)
    IX Power bringt die unschlagbare Präzision von FX Power endlich auch zu Nicht-Forex-Symbolen. Es bestimmt präzise die Intensität von kurz-, mittel- und langfristigen Trends in Ihren Lieblingsindizes, Aktien, Rohstoffen, ETFs und sogar Kryptowährungen. Sie können alles analysieren, was Ihr Terminal zu bieten hat. Probieren Sie es aus und erleben Sie, wie sich Ihr Timing beim Handel deutlich verbessert . IX Power Hauptmerkmale 100% präzise, nicht nachpinselnde Berechnungsergebnisse - für
    DERZEIT 31% RABATT! Die beste Lösung für jeden Newbie oder Expert Trader! Dieser Indikator ist ein einzigartiges, qualitativ hochwertiges und erschwingliches Handelsinstrument, da wir eine Reihe von proprietären Funktionen und eine geheime Formel eingebaut haben. Mit nur EINEM Chart liefert er Alerts für alle 28 Währungspaare. Stellen Sie sich vor, wie sich Ihr Handel verbessern wird, weil Sie in der Lage sind, den genauen Auslösepunkt eines neuen Trends oder einer Scalping-Gelegenheit zu e
    Hinterlassen Sie nach dem Kauf einen Kommentar, um 4 hochwertige Indikatoren als Bonus zu erhalten. Der Chart Patterns All-in-One Indikator hilft Tradern, verschiedene Chartmuster, die häufig in der technischen Analyse verwendet werden, zu visualisieren. Dieser Indikator unterstützt die Identifizierung möglicher Marktbewegungen, garantiert jedoch keine Rentabilität. Es wird empfohlen, den Indikator vor dem Kauf im Demomodus zu testen. Aktuelles Angebot : 50 % Rabatt auf den "Chart Patterns All i
    Werden Sie Breaker Trader und profitieren Sie von Änderungen der Marktstruktur, wenn sich der Preis umkehrt. Der Order Block Breaker Indikator zeigt an, wann sich eine Trend- oder Preisbewegung der Erschöpfung nähert und bereit ist, sich umzukehren. Es weist Sie auf Änderungen in der Marktstruktur hin, die normalerweise auftreten, wenn eine Umkehrung oder ein größerer Rückzug bevorsteht. Der Indikator verwendet eine proprietäre Berechnung, die Ausbrüche und Preisdynamik identifiziert. Jedes
    Blahtech Supply Demand
    Blahtech Limited
    4.61 (33)
    Was: $299  Now: $99   Supply Demand uses previous price action to identify potential imbalances between buyers and sellers. The key is to identify the better odds zones, not just the untouched ones. Blahtech Supply Demand indicator delivers functionality previously unavailable on any trading platform. This 4-in-1 indicator not only highlights the higher probability zones using a multi-criteria strength engine, but also combines it with multi-timeframe trend analysis, previously confirmed swings
    Weitere Produkte dieses Autors
    Gleitende Durchschnitte ändern sich unterwegs. Der Indikator wählt automatisch einen Zeitraum für die Berechnung der gleitenden Durchschnitte aus. Je gerichteter die Bewegung ist, desto größer ist die Mittelungsperiode. Wenn sich der Trend verlangsamt, nimmt die Periode der gleitenden Durchschnitte ab und sie werden schneller. Dies ermöglicht eine schnellere Reaktion auf eine Trendwende.  Der Indikator funktioniert gut in einem Trend oder an einem Trendumkehrpunkt. In der Seitenwand kann der
    FREE
    Button CCI
    Aleksandr Kononov
    Endlich wurde die Schnittstelle benutzerfreundlich. Jetzt können Sie die Periode des Indikators mit der Maus steuern. Klicken Sie einfach auf die Schaltfläche und scrollen Sie mit dem Mausrad, um den CCI-Zeitraum zu erhöhen oder zu verringern. Die Taste kann an beliebiger Stelle platziert, gesichert und mit einem einzigen Tastendruck verwendet werden. In einem Diagramm können Sie mehrere Indikatoren festlegen und sie einzeln oder auf einmal verwalten. Die einfache Installation auf dem Diagramm
    FREE
    Standard Scroller
    Aleksandr Kononov
    Das Dienstprogramm steuert jeden Parameter eines Indikators mit dem Mausrad. Sie können dieses Dienstprogramm installieren und die Schnittstelle eines beliebigen Indikators aus der Standardlieferung des Terminals ändern . Für benutzerdefinierte Indikatoren, die auch auf dem "Market" gekauft wurden, gibt es das Dienstprogramm Universal Scroller . Funktionsprinzip Das Dienstprogramm steuert eine der Optionen, die Sie auswählen, indem Sie sie mit dem Mausrad ändern. Sie können den Bildlaufmodus
    FREE
    Button MA
    Aleksandr Kononov
    5 (1)
    Die Schaltfläche zum Steuern des Moving Average-Indikators ermöglicht es Ihnen, den Zeitraum des Indikators mit dem Mausrad direkt auf dem Diagramm zu ändern. Es ist nicht notwendig, den Bildschirm oft von der Grafik auf die Anzeigeeinstellungen umzuschalten. Jetzt können Sie die Periode des Indikators mit der Maus steuern. Klicken Sie einfach auf die Schaltfläche und scrollen Sie mit dem Mausrad, um den Moving Average-Zeitraum zu erhöhen oder zu verringern. Die Taste kann an beliebiger Stelle
    Universal Scroller
    Aleksandr Kononov
    Das Dienstprogramm steuert jeden Parameter eines Indikators, indem es das Mausrad durchläuft. Wenn Sie einen Indikator gekauft oder gemietet haben, können Sie seine Benutzeroberfläche mit diesem Dienstprogramm ändern. Jeder Indikator, der mindestens einen ganzzahligen Parameter enthält, ist dafür geeignet.  Wenn Sie zuerst versuchen möchten, wie es funktioniert, laden Sie den kostenlosen Standart Scroller herunter, um die Indikatoren aus der Standardlieferung des Terminals zu steuern.  Funk
    Auswahl:
    Viktor Kononov
    118
    Viktor Kononov 2022.03.13 16:32 
     

    Der Benutzer hat keinen Kommentar hinterlassen

    julian karpet
    184
    julian karpet 2022.03.01 22:37 
     

    Is not this a duplicate indicator? Create new ideas. Thankful

    Aleksandr Kononov
    2676
    Antwort vom Entwickler Aleksandr Kononov 2022.03.01 22:43
    No, there is a slightly different way of calculating. The borders are smoother and automatic adjustment to the price movement is added.
    Antwort auf eine Rezension
    Version 1.82 2022.04.06
    Die Funktion zum Senden von Nachrichten wurde hinzugefügt. Kleinere Fehler behoben
    Version 1.81 2022.04.05
    Мелкие баги
    Version 1.80 2022.04.05
    Added rendering Farben für die Anzeige der geschätzten Zone-Anzeige (period), ausbessern Grenzen des Kanals durch Berührung der Preis.
    Version 1.70 2022.04.01
    Es wurden Preise für andere Methoden zur Berechnung von Grenzen und Mittellinie hinzugefügt. Rendert die Grenze des Berechnungszeitraums. Möglichkeit, die Geschwindigkeit der Grenzbewegung zu ändern. Möglichkeit, keine dynamische Berechnung zu verwenden, sondern die Kanalbreite manuell festzulegen
    Version 1.60 2022.04.01
    Added light and dark theme
    Version 1.50 2022.03.30
    Vorlage hinzugefügt
    Version 1.40 2022.03.30
    Wenn Sie einen Zeitplan festlegen oder den Zeitrahmen ändern, berechnet der Indikator die vorherigen Bewegungen sofort neu (jetzt müssen Sie nicht warten)
    Version 1.20 2022.03.30
    Fixed a bug, now the channel is not only expanding, but also narrowing.
    Version 1.10 2022.03.04
    Изменение алгоритма расчета