Boom and Crash Spike Detector Indicator for MT4
- Indikatoren
- STE S.S.COMPANY
- Version: 1.2
- Aktualisiert: 29 Oktober 2022
- Aktivierungen: 10
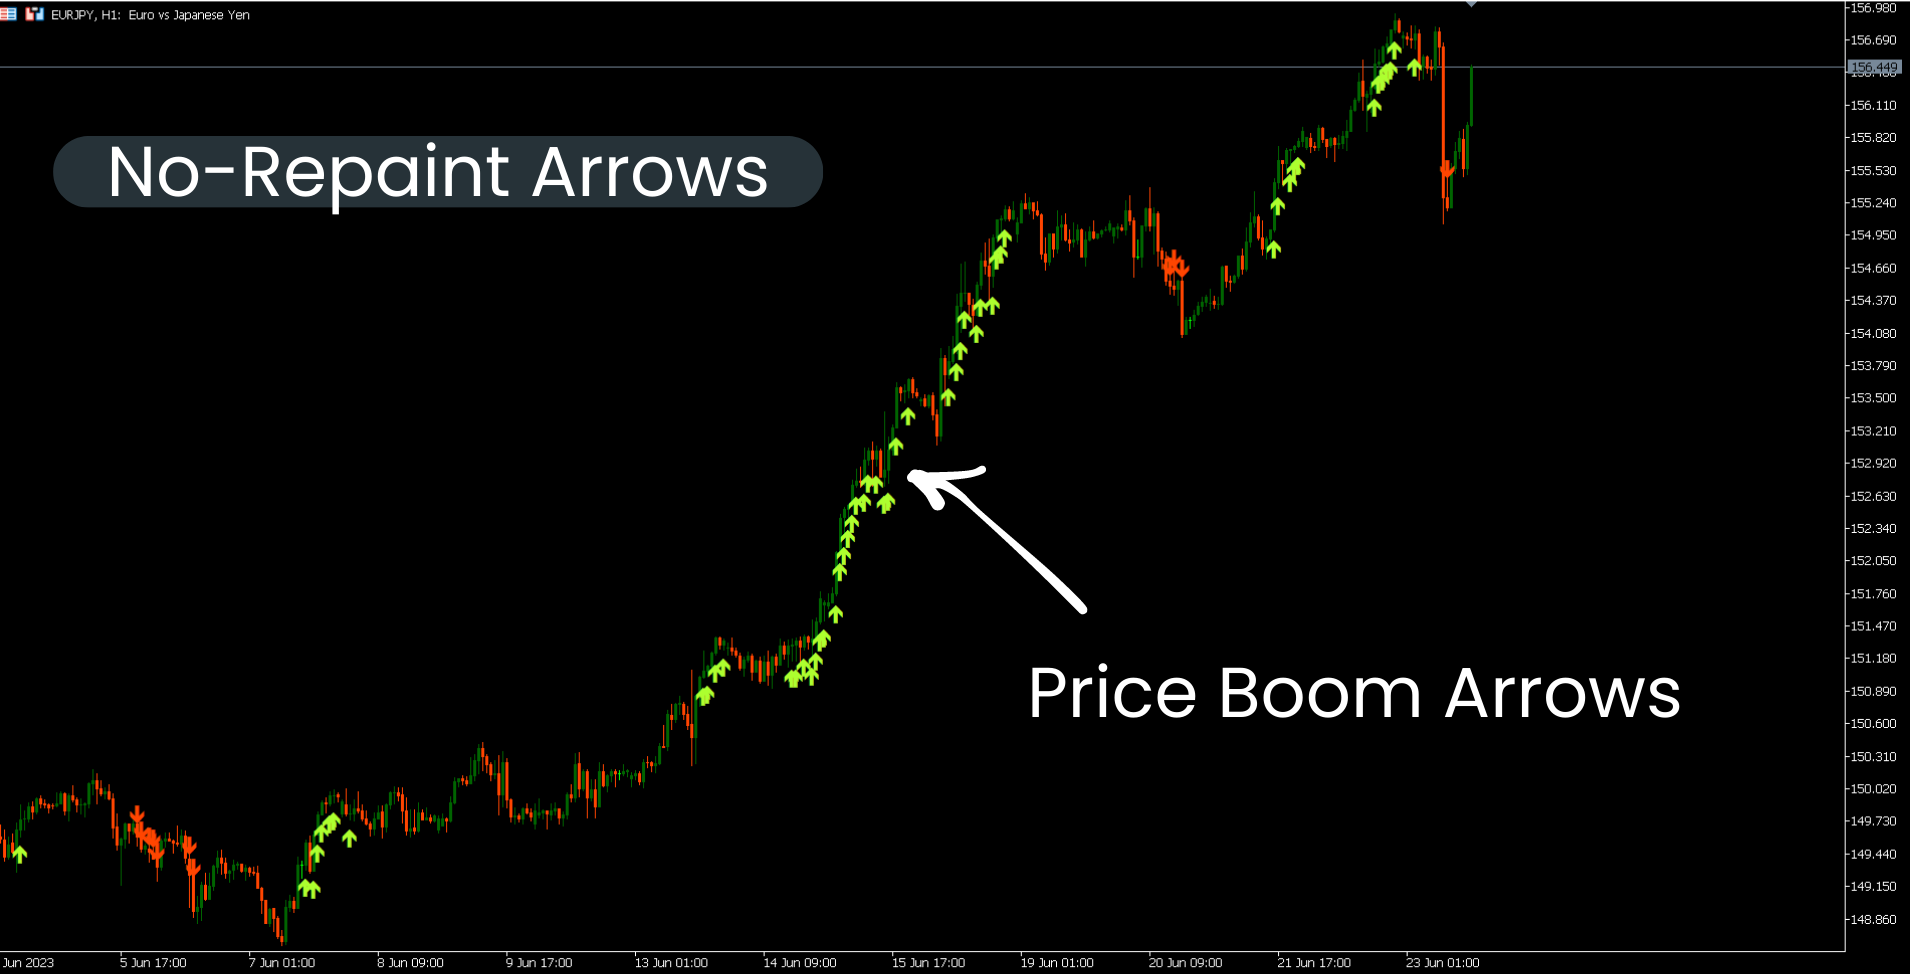
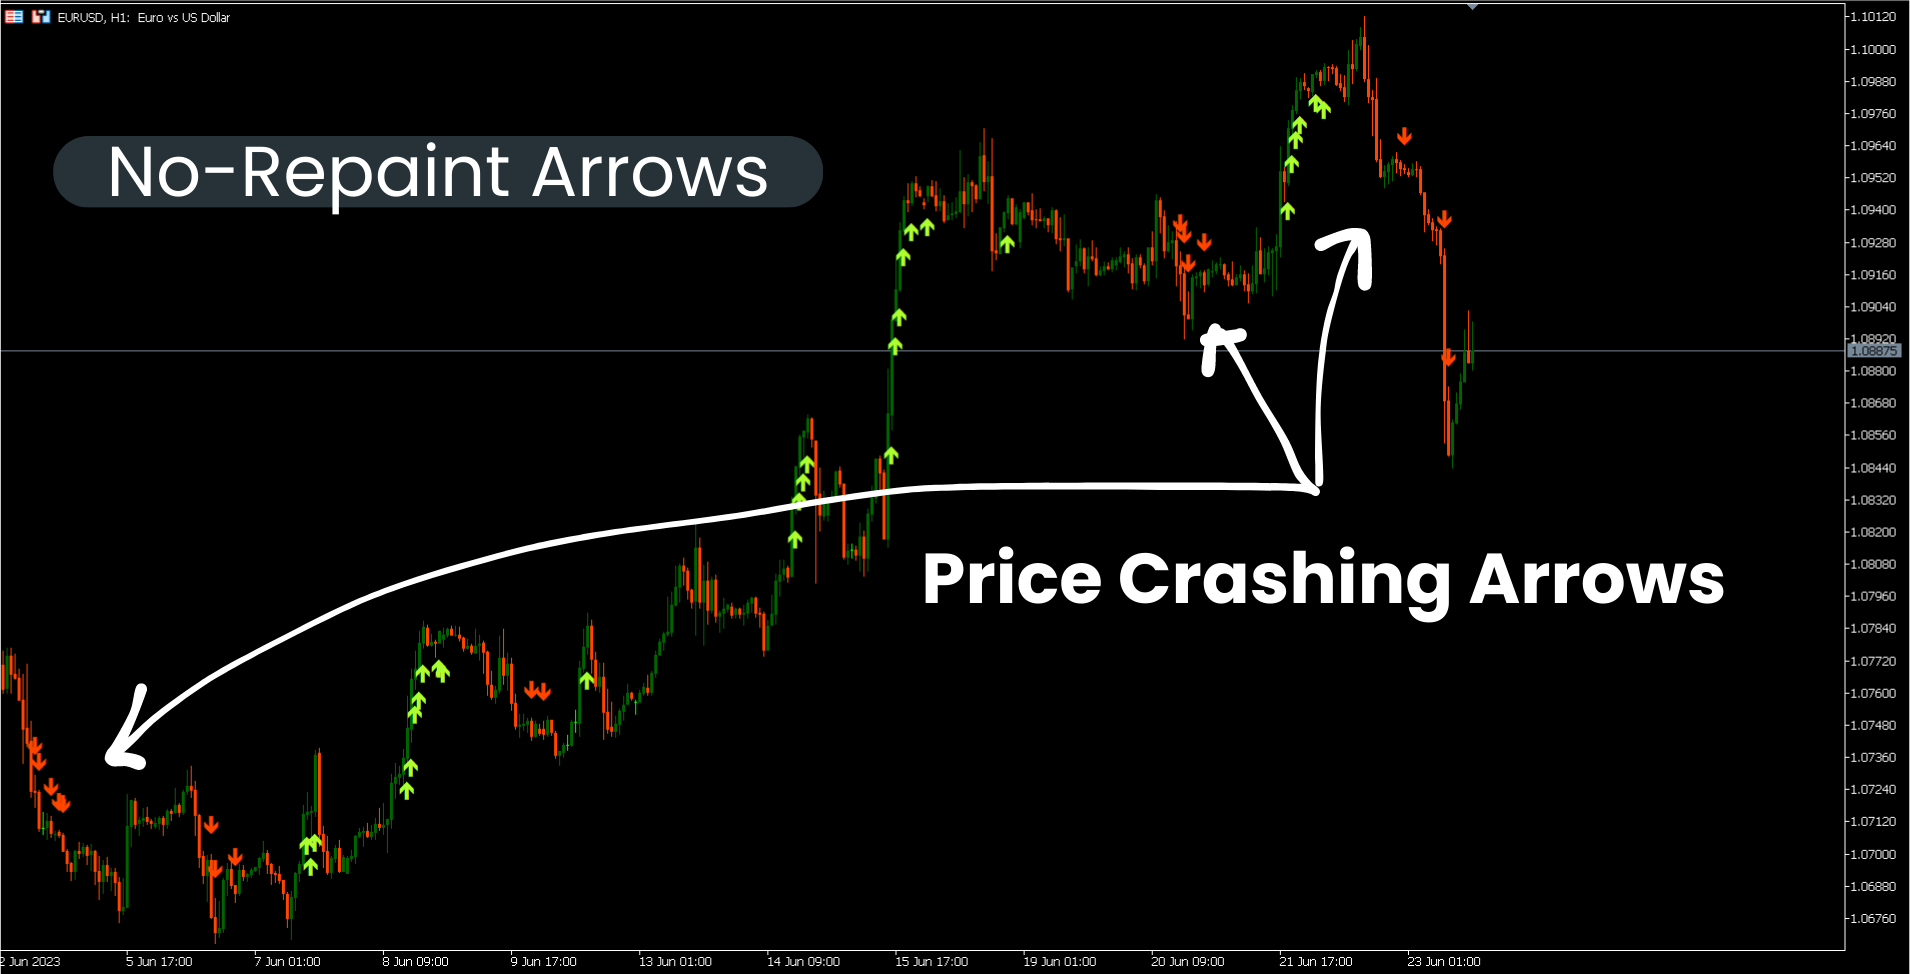
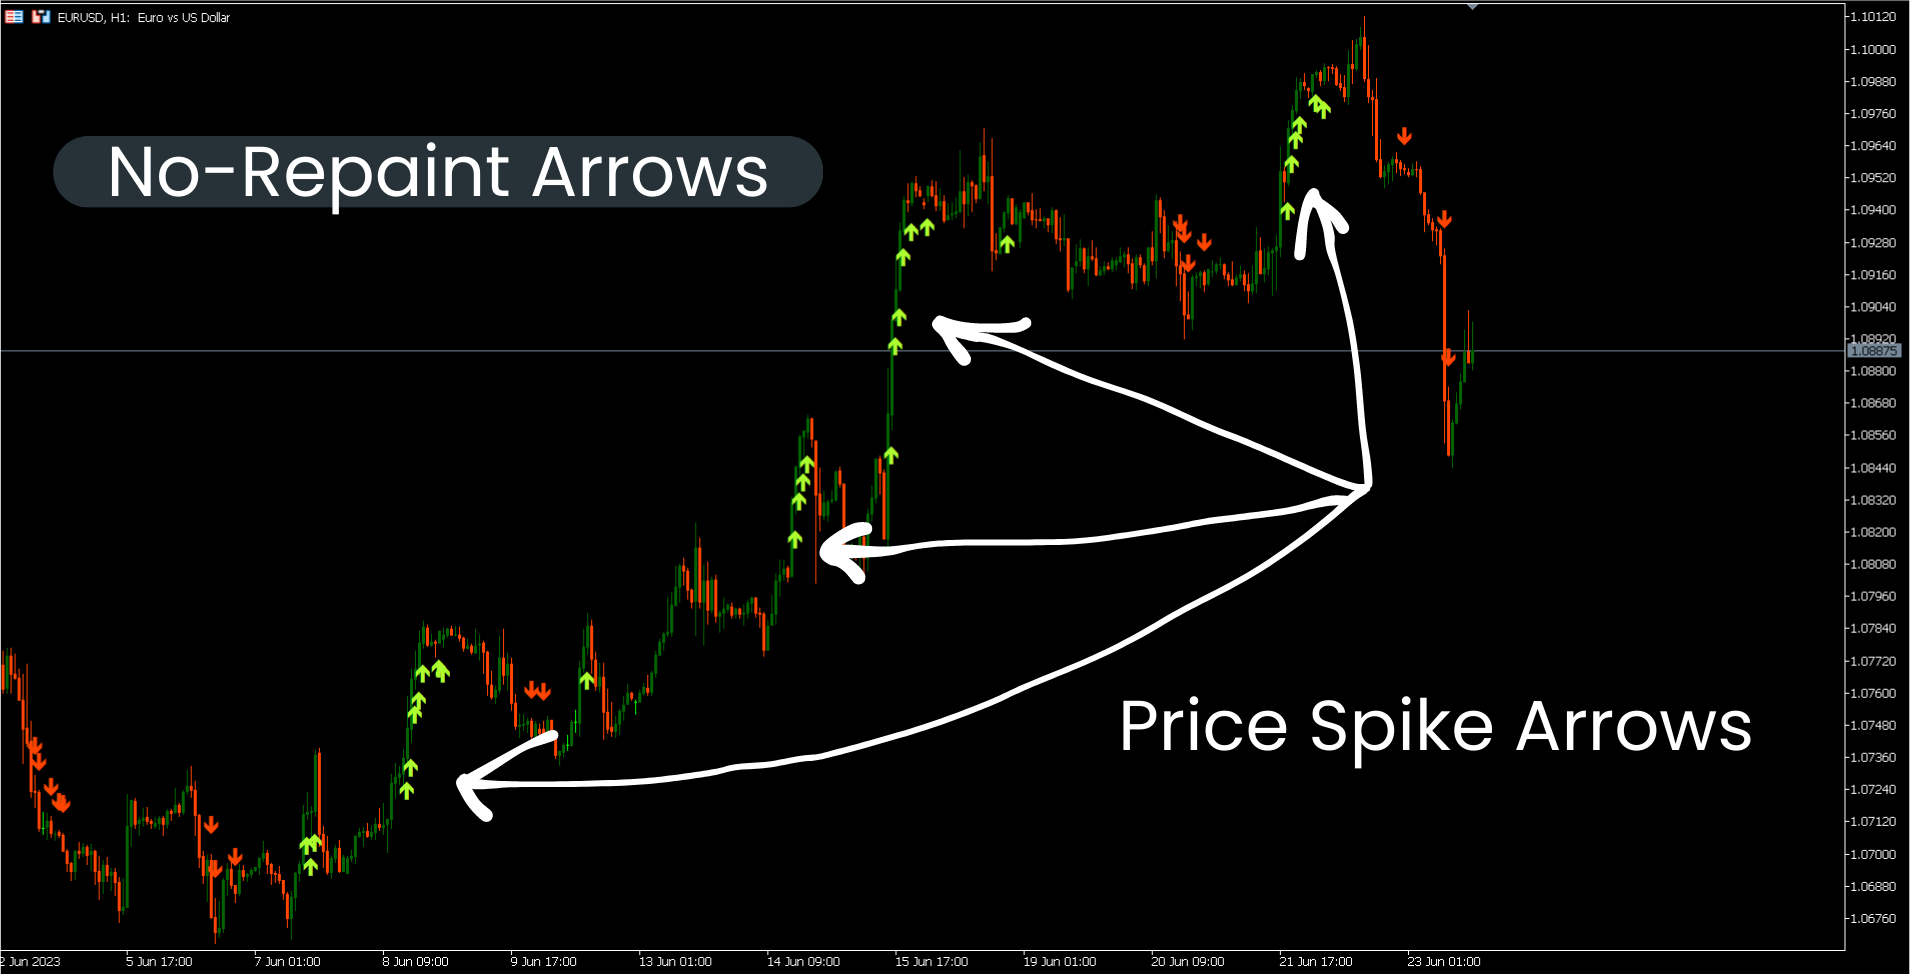
Der Boom and Crash Spike Detector Indikator ist basierend auf einer fortschrittlichen Strategie kodiert, hauptsächlich um den Boom und Crash in den Preisen zu erkennen. Komplexe Algorithmen wurden implantiert, um Booms und Crashs mit hoher Wahrscheinlichkeit in den Preisen zu erkennen. Es warnt vor möglichen Boom- oder Crash-Phasen:
- Boom-Phase: Wenn der Preis zu schnell steigt.
- Crash-Phase: Wenn der Preis zu schnell sinkt.
ZEITLICH BEGRENZTES ANGEBOT: Der Indikator ist für nur 30$ und lebenslang erhältlich.
Hauptmerkmale
- Sendet Push-Benachrichtigungen an das Mobiltelefon
- Pop-up- und Tonwarnungen auf Computer oder Laptop
- Zeigt Pfeile ohne Neulackierung an (Pfeile nach oben für potenziellen Boom und Pfeile nach unten für potenziellen Absturz)
- Arbeiten mit allen Paaren.
Empfehlung
- Zeitrahmen: H1 und H4
- Paare empfehlen: Paare in Trendphasen.
Kontakt
Wenn Sie Fragen haben oder Hilfe benötigen, kontaktieren Sie mich per Privatnachricht.
Autor
SAYADI ACHREF , Fintech-Softwareingenieur und Gründer von Finansya.


I will give this Boom & Crash indicator the five star review that it deserves! It is very accurate in finding fast moving pairs. Also it is NOT REPAINT, which is key as so many other indicators look "perfect" but end up being worthless, even some here on this platform. I will contact the head coding genius Sayadi to see if possible to get a custom improvement but overall very happy with this indicator! Also it is an incredible value. A+ by Jim