Qv2 Trend
- Indikatoren
- Joao Marcilio
- Version: 1.30
- Aktualisiert: 26 Januar 2022
- Aktivierungen: 5
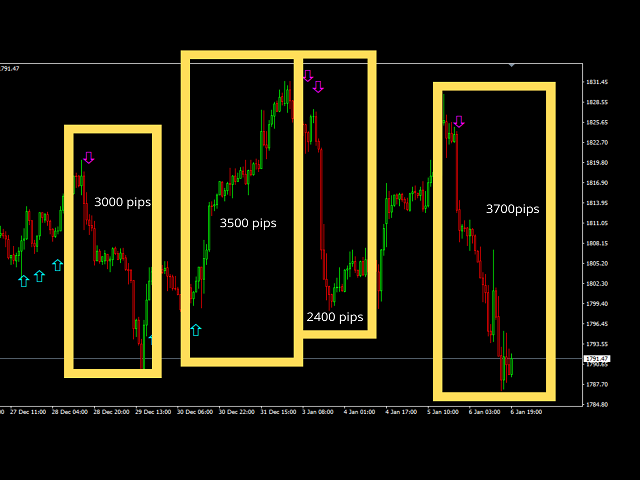
The Qv² Trend is an indicator that aims to identify trends.
Buying trend signals are indicated by arrows pointing up.
Selling trend signals are indicated by arrows pointing down.
It can be used in all deadlines.
It can be used in all pairs.
I use it on the H1 with a period of 24.
Important note: I recommend using it in markets that naturally show trends. For in range markets I present my other indicator on this link OBOS