Audusd and Nzdusd Hedge Trade Simulator
- Indikatoren
- GEORGIOS VERGAKIS
- Version: 1.0
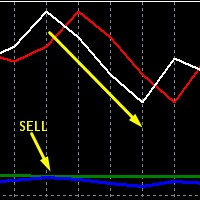
This is a simple free tool for simulating trades when trading both AUDUSD and NZDUSD in a hedge strategy, you can drop the indicator on either market chart. It is essential because you cannot tell at a glance, what a combined trade would be like, just by looking at the two individual charts separately.
New premium low cost indicator
How to use:
Drop the indicator on either AUDUSD or NZDUSD chart, or any other chart, it will work.
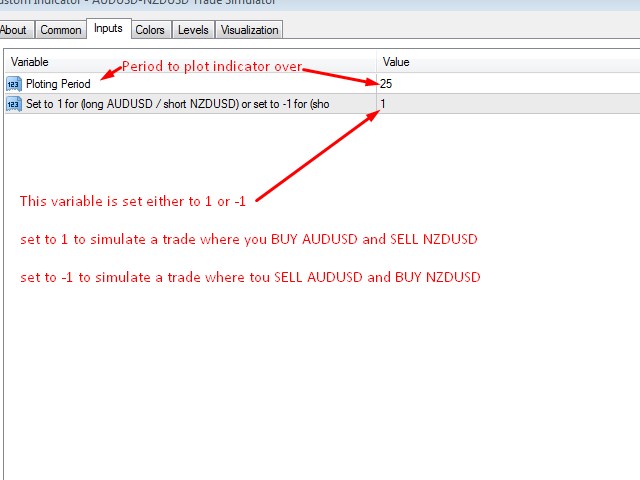
You choose ploting period, to the number of days/weeks months you wish. and set the second parameter to 1 or -1, whether you buy AUDUSD and sell NZDUSD (set to 1) or if you sell AUDUSD and buy NZDUSD (set to -1). Default setting is 1.
1 and -1 is for trading one lot on each pair, calculated for an account with 100:1 leverage. If you want to say see what would happen if you were long 5 lots on AUDUSD and short 5 lots on NZDUSD simply set this parameter to 5, or to -5 for the reverse trade.
For large account trading, such as accounts that have been almost totally blown and traders have lost 80% of their funds in clasic trading methods, this strategy, together with our, premium indicator makes it possible to seriosuly recover all the way back to the top. Our premium indicator costs over $3,000 per year, but it provides low risk, and even ultra low risk signals. Only traders who have previously lost in excess of $30,000 know what it means to recover such losses. The only way to recover, is through hedge strategies such as this one.
Just think for a minute, why most traders lose, it's because they use tight directional single pair strategies, and they end up getting trapped on the wrong side of the market!
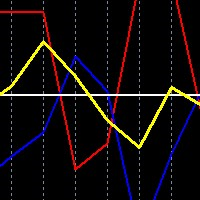
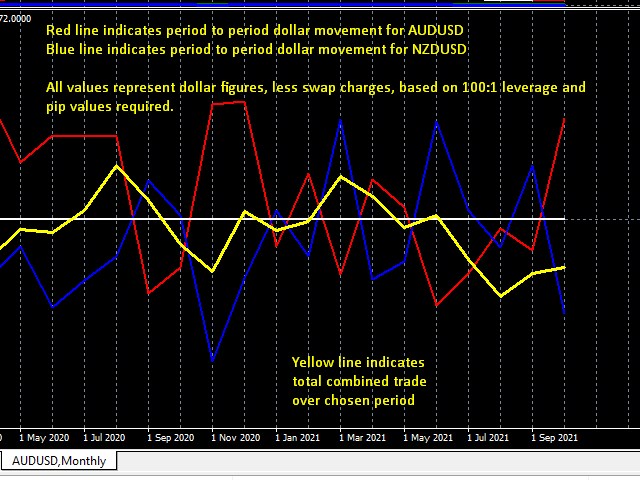
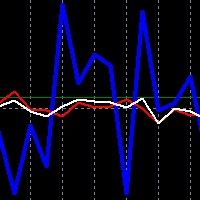
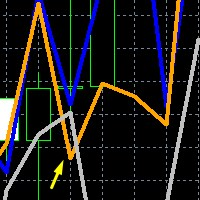
This indicator will show you on the yellow line what the total combined trade dollar amount would look like for trading one lot each pair, at 100:1 leverage (no swap charges are taken into account).
1)This kind of hedge trading requires at least few days to show singificant profit/loss, compared to single pair trading. Nonetheless, it often moves by $100 over the course of few hours, in a smooth, solid trend, despite the ups and downs of each pair. The key to fast profitability is knowing how to trade these in every given day. More specifically the individual trades in either pair, go through a lot of ups and downs, making single pair trading too difficult. The 2 pairs together have longer lasting combined trend and meaningful signals.
2)Why trade 2 correlated pairs? - Opposite trades on correlated pairs result in smoother trends and higher probability of winning, since there's less chance of getting trapped on the wrong side. Think about it, why do most forex traders lose money? it's because they have an opinion about market direction, and they end up getting trapped on the wrong side. With multiple pairs trading the oscillations create such volatility that the total trade has much lower chance of becoming trapped. Even if one pair goes totally in the wrong, least expected direction, the other offseting trade still has a chance to make the total trade profitable for periods lasting from few hours to several days.
3) The 2 pairs have hidden bounding conditions, of at least one type where being long AUDUSD and short NZDUSD becomes absolutely overbought! This doesn't exist in either pair on its own, as you know all kinds of overbought indicators such as RSI can simply become more and more overbought, and you never know when the real reversal will happen.
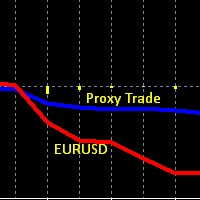
4) We have a top notch, premium indicator for EURUSD, which can be used for trading the correlation strategy between AUDUSD and NZDUSD the secret is that when EURUSD rises, then AUDUSD will fall relative to NZDUSD and vice versa. You can fully use this indicator for this strategy, you just need to focus on the daily and medium term trend, not the very short term such as 30min, because the correlation doesn't show up in small time frames. But it does show up for the entire day. For specifically trading the correlation, we have this premium indicator here.
