Chart Window ControlPanel MT4
- Indikatoren
- Leonid Basis
- Version: 4.15
- Aktualisiert: 24 April 2020
- Aktivierungen: 5
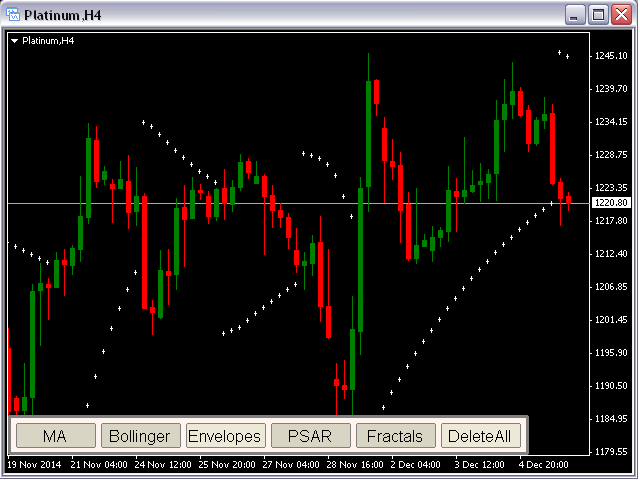
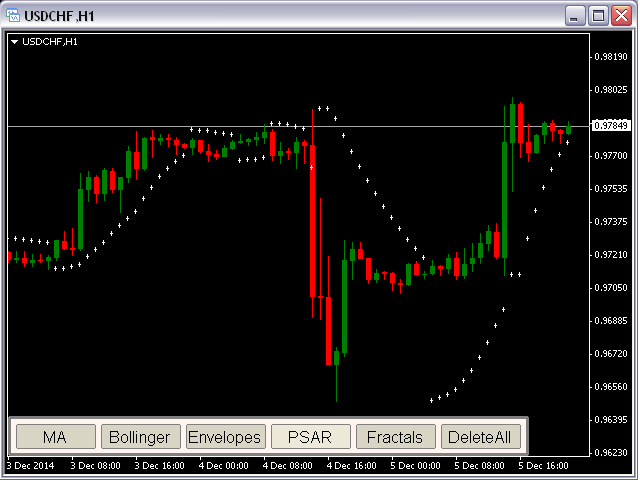
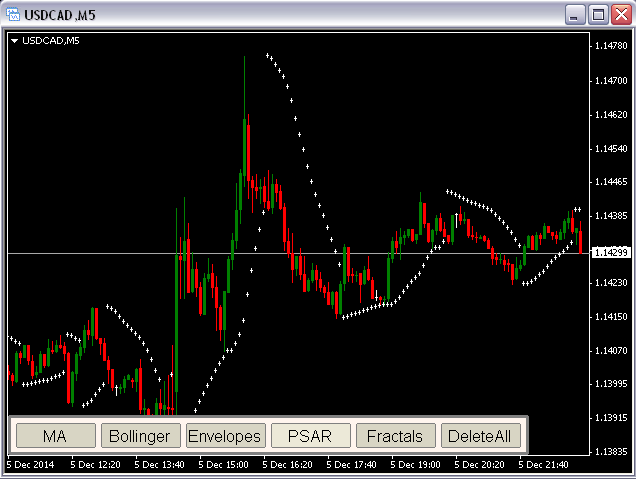
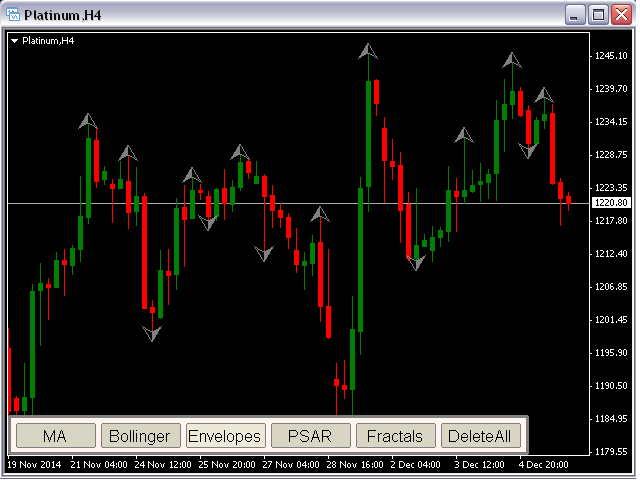
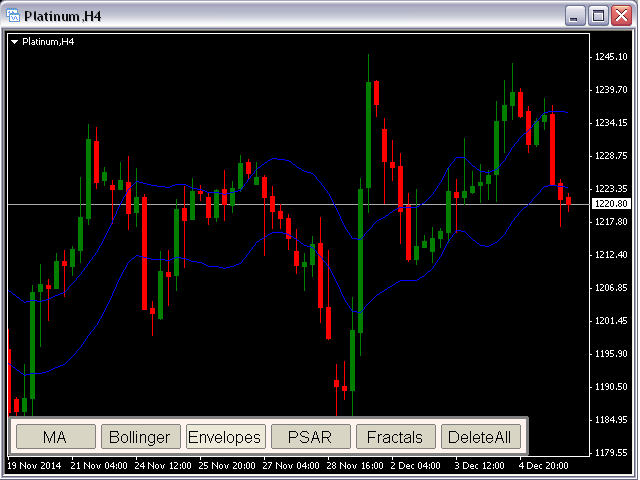
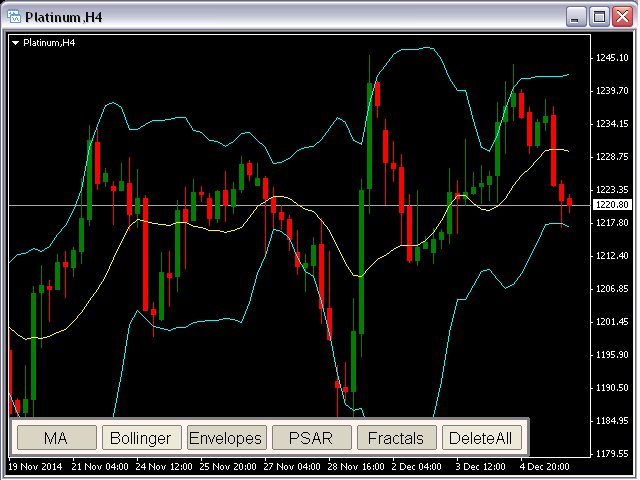
This is a Control Panel for major chart indicators: Moving Averages, Bollinger Bands, Envelopes, PSAR and Fractals.
You have the ability to change any input parameters for each indicator.
For example:
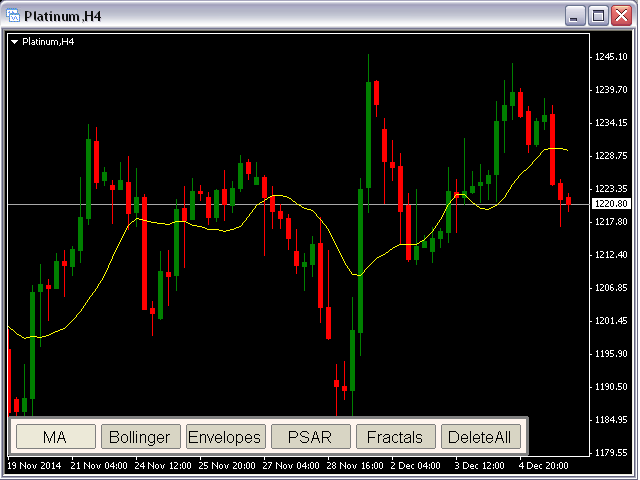
MA
- maPeriod = 13;
- ma_method = MODE_SMA;
- app_price = PRICE_CLOSE;
- maColor = Yellow;
Bands
- bbPeriod = 20;
- bb_dev = 2;
- bb_Price = PRICE_CLOSE;
- bbColor = Aqua;
This indicator will be helpful for those who like to use many indicators before any decision making.