• Übersicht
  • Bewertungen
  • Diskussion

Managed Trades

This utility is specifically designed for No Nonsense Forex traders.

What it does:-

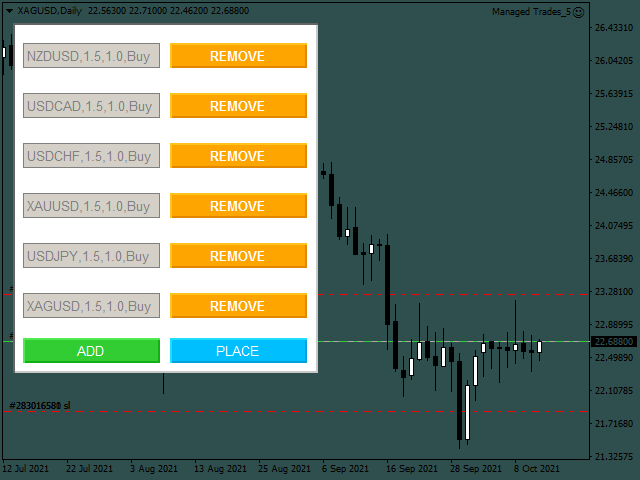
  • Let traders add or remove symbols to trade
  • Editable boxes in panel for updating inputs
  • Automatically applies money management to the trades
  • Places all orders with a single click 

How it calculates:-

  • Two trades are opened per symbol
  • By default max risk per trade is 1%
  • By default total risk is 6% which can changed in inputs tab(recommended to keep it 6 or below) 
  • On addition of symbols the total risk will be divided equally among all assets. For example if total added symbols are 6 then risk will be 1% per symbol and 0.5% per trade
  • Risk can be by account balance or equity which can be selected in inputs tab also
  • Volatility metric for lot calculation is ATR(Average True Range)
  • Editable inputs are in format(Symbol,Stop loss multiplier,Take profit multiplier,Order type). The first input is a constant and doesn't need to be changed

What it doesn't do:-

The utility doesn't check if sessions are opened for all added symbols so the user needs be aware of the session status of the symbol added. Roll over times need to taken into consideration also.

Empfohlene Produkte
Program Overview: This program is a trading tool designed to monitor and analyze the 7 major currency pairs. It is a variant of a similar program used for tracking stock indices, but this version focuses on the seven major currency pairs. The program helps in identifying and calculating significant price movements (gaps) between the high and low prices of these currency pairs over a specified time frame. It then provides insights through comments and alerts based on the calculated gaps. Major Cu
The indicator allows you to trade binary options. The recommended time frame is М1 and the expiration time is 1,2,3 minutes. The indicator suitable for auto and manual trading. A possible signal is specified as a arrows above/under a candle. You should wait until the candle closes! Arrows are not re-painted Trade sessions: TOKYO section (Half-end) Currency pairs: USD/JPY Working time frame: M1 Expiration time: 1,2,3 minutes. The indicator also shows good results when using the martingale strateg
FREE
Super Reversal Pattern
Parfait Mujinga Ndalika
Super Reversal Pattern Indicator Unlock the power of advanced pattern recognition with our Super Reversal Pattern Indicator. Designed for traders seeking precision and reliability, this indicator identifies one of the most effective reversal patterns in technical analysis, offering a significant edge in your trading strategy. Key Features: Non-Repainting Accuracy: Enjoy the confidence of non-repainting technology. Once a Super Reversal Pattern is detected, it remains static, providing consis
VR Cub
Vladimir Pastushak
VR Cub ist ein Indikator für den Erhalt hochwertiger Einstiegspunkte. Der Indikator wurde entwickelt, um mathematische Berechnungen zu erleichtern und die Suche nach Einstiegspunkten in eine Position zu vereinfachen. Die Handelsstrategie, für die der Indikator geschrieben wurde, hat sich seit vielen Jahren bewährt. Ihr großer Vorteil liegt in der Einfachheit der Handelsstrategie, die es auch unerfahrenen Händlern ermöglicht, erfolgreich damit zu handeln. VR Cub berechnet Positionseröffnungspunkt
Master Scalping M1 ist ein innovativer Indikator, der einen Algorithmus verwendet, um den Trend schnell und genau zu bestimmen. Der Indikator berechnet den Zeitpunkt zum Öffnen und Schließen von Positionen, die Indikatoralgorithmen ermöglichen es Ihnen, die idealen Zeitpunkte für den Einstieg in einen Handel (Kauf oder Verkauf eines Vermögenswerts) zu finden, was den Erfolg von Transaktionen für die meisten Händler erhöht. Vorteile des Indikators: Einfach zu bedienen, überladen Sie das Diagramm
Daily Candle Predictor ist ein Indikator, der den Schlusskurs einer Kerze vorhersagt. Der Indikator ist in erster Linie für die Verwendung in D1-Charts gedacht. Dieser Indikator eignet sich sowohl für den traditionellen Devisenhandel als auch für den Handel mit binären Optionen. Der Indikator kann als eigenständiges Handelssystem oder als Ergänzung zu Ihrem bestehenden Handelssystem verwendet werden. Dieser Indikator analysiert die aktuelle Kerze und berechnet bestimmte Stärkefaktoren innerhalb
Horizontal tick volumes (HTV) Horizontal tick volumes - an easy and convenient indicator of a horizontal market profile in a user-selected time. Produces a visual image of strong trading levels by maximum peaks past volumes and trading direction by color (sell or buy), and also allows you to detect smaller trading levels by differentiating past volumes. In the "Optimal" mode, when displayed on chart periods up to and including "M30", the data of one-minute bars are used, on H1 and H4 - five-minu
Blahtech Market Profile
Blahtech Limited
4.56 (16)
Was: $249  Now: $99   Market Profile defines a number of day types that can help the trader to determine market behaviour. A key feature is the Value Area, representing the range of price action where 70% of trading took place. Understanding the Value Area can give traders valuable insight into market direction and establish the higher odds trade. It is an excellent addition to any system you may be using. Blahtech Limited presents their Market Profile indicator for the MetaTrader community. Ins
Volume by Price MT4
Brian Collard
4.64 (11)
The Volume by Price Indicator for MetaTrader 4 features Volume Profile and Market Profile TPO (Time Price Opportunity). Volume and TPO histogram bar and line charts. Volume Footprint charts. TPO letter and block marker collapsed and split structure charts. Static, dynamic and flexible range segmentation and compositing methods with relative and absolute visualizations. Session hours filtering and segment concatenation with Market Watch and custom user specifications. Graphical layering, positio
Noize Absorption Index MT4
Ekaterina Saltykova
5 (1)
Noize Absorption Index - is the manual trading system that measures the difference of pressure between bears forces and bulls forces. Green line - is a noize free index that showing curent situation. Zero value of index shows totally choppy/flat market.Values above zero level shows how powerfull bullish wave is and values below zero measures bearish forces.Up arrow appears on bearish market when it's ready to reverse, dn arrow appears on weak bullish market, as a result of reverse expectation. S
Eine der Zahlenfolgen heißt „Forest Fire Sequence“. Es wurde als eine der schönsten neuen Sequenzen anerkannt. Sein Hauptmerkmal ist, dass diese Sequenz lineare Trends vermeidet, selbst die kürzesten. Diese Eigenschaft bildete die Grundlage dieses Indikators. Bei der Analyse einer Finanzzeitreihe versucht dieser Indikator, alle möglichen Trendoptionen abzulehnen. Und nur wenn er scheitert, dann erkennt er das Vorhandensein eines Trends und gibt das entsprechende Signal. Dieser Ansatz ermöglicht
Description: Please tick "Show object descriptions" in chart properties to enable hrays views That utility converts a trendline into a horizontal ray known as tool for drawing supply and demand zones. Simply create a trendline on a chart and once selected, it will get converted. Ray remains horizontal while dragging.  Quick ray plot: press "R" key to create horizontal ray. It will be snapped to the nearest OHLC value Further versions will be improved. For feature request please post new c
ICT Kill zone and Macros Indicator mark and display the following zone times on the chart: Kill zones   Kill zone Forex Asian London Open New York Open London Close Central Bank Dealing range Kill zone Indices Asian London Open New York AM New York Lunch New York PM Power Hour Macros London 1 London 2 New York Am 1 New York AM 2 New York Lunch New York PM 1 New York PM 2 Silver bullet London Open New York AM New York PM Sessions Asian London New York Chart The display of  Kill zone ,
For sure, this indicator has become very popular amongst traders. Through coding this indicator will give you the most accurate levels possible for your trading analysis. We have also added in the ability for you to receive alerts when the price breaks above or below a Support or Resistance lines! HOW TO USE The red rectangles represent your resistance/supply zone. The green rectangles represent your support/demand zone.  BONUS FEATURES We coded this indicator with the ability to switch between
Profile Map
Dmitriy Sapegin
5 (11)
Market Profile helps the trader to identify the behavior if major market players and define zones of their interest. The key feature is the clear graphical display of the range of price action, in which 70% of the trades were performed. Understanding of the location of volume accumulation areas can help traders increase the probability of success. The tool can be used as an independent system as well as in combination with other indicators and trading systems. this indicator is designed to suit
Ugenesys AI MT4
Odaine Ramon Mcmillan
5 (1)
uGenesys AI - 90% Accurate Daytrading Indicator Introducing the ultimate forex trading indicator system, uGenesys AI, powered by cutting-edge AI technology and advanced analytical techniques, including Time-Series Analysis and Genetic Algorithms. Our AI-powered trading system leverages the power of time-series analysis to identify trends and patterns in historical price data, allowing traders to make informed predictions about future market movements. By analyzing vast amounts of data, our sys
The Best One Scalping Trade Panel functional manual trade panel with risk reward, auto SL by candle ( original solution), lot size calculation, one-click trading, scale in and out of trades (partial close),  Works with all symbols not just currency pairs, perfect works on DAX, NASDAQ, GOLD, ...... I earn every day during live stream on ZakopiecFX - join Me Risk by lot Risk by percent SL by points SL by Candle, Renko, RangeBar ( original solution) TP by point TP by Risk/Reward Auto Trailing b
Are you tired of plotting fibonacci retracements or extensions manually? This indicator displays fibonacci retracements or extensions automatically, calculated from two different price points, without human intervention or manual object anchoring.  [ Installation Guide | Update Guide | Troubleshooting | FAQ | All Products ] Easy to use Manual anchoring is not needed Perfect for price confluence studies The indicator evaluates if retracements or extensions are needed Once drawn, you can manually
We present you the indicator "Candle closing counter", which will become your indispensable assistant in the world of trading. That’s why knowing when the candle will close can help: If you like to trade using candle patterns, you will know when the candle will be closed. This indicator will allow you to check if a known pattern has formed and if there is a possibility of trading. The indicator will help you to prepare for market opening and market closure. You can set a timer to create a p
The Penta-O is a 6-point retracement harmonacci pattern which usually precedes big market movements. Penta-O patterns can expand and repaint quite a bit. To make things easier this indicator implements a twist: it waits for a donchian breakout in the right direction before signaling the trade. The end result is an otherwise repainting indicator with a very reliable trading signal. The donchian breakout period is entered as an input. [ Installation Guide | Update Guide | Troubleshooting | FAQ | A
TWO PAIRS SQUARE HEDGE METER INDICATOR Try this brilliant 2 pairs square indicator It draws a square wave of the relation between your two inputs symbols when square wave indicates -1 then it is very great opportunity to SELL pair1 and BUY Pair2 when square wave indicates +1 then it is very great opportunity to BUY pair1 and SELL Pair2 the inputs are : 2 pairs of symbols         then index value : i use 20 for M30 charts ( you can try other values : 40/50 for M15 , : 30 for M30 , : 10 for H1 ,
Trade with Gann on your side!! MASTER CIRCLE 360 CIRCLE CHART, originally created by Gann admitted that this is “The Mother of all charts”. It is one of the last studies that this great trader left for us. The numeric tab le is apparently quite simple like all the tables and is based on square numbers, the SQUARE OF 12 and is by evolution, one of the most important square numbers. Here we can find CYCLE, PRICE AND TIME thanks to angles and grades, to show past and future support and resistance.
Cosmic Diviner X Planet
Olena Kondratenko
4 (2)
This unique multi-currency strategy simultaneously determines the strength of trends and market entry points, visualizing this using histograms on the chart. The indicator is optimally adapted for trading on the timeframes М5, М15, М30, Н1. For the convenience of users, the indicator renders the entry point (in the form of an arrow), recommended take profit levels (TP1, TP2 with text labels) and the recommended Stop Loss level. The take profit levels (TP1, TP2) are automatically calculated for
Real-time spread tracking and monitoring software Displays spread values in form of histograms on current timeframe of chart Convenient for analyzing spread changes, as well as for comparing trading conditions of different brokers By placing on desired chart, the spread changes at different trading times are displayed Additionally Fully customizable Works on any instrument Works with any broker
Market Viewer
Matimu Romeo Ngoveni
Market Viewer This utility seeks to assist the trader in identifying potential areas of interest on the price chart. Different components integral to decision making have been automated, allowing the user to engage with perfectly calculated levels. Some components include the weeks initial balance, session Min and Max areas and a round number indicator altogether forming templates providing confidence to the trader. Have a look at the screenshots for a sneak peak into the components. The utility
Инструмент для торговли скальпингом с использованием профиля рынка. Позволяет торговать по рынку, а так же оттачивать навыки торговли в тестере стратегий. При минимальном интерфейсе имеет высокую функциональность и пользу для торговли от уровня Point Of Control (POC). Как торговать с помощью советника - утилиты Market profile scalper, смотрите видео. Настройки - - - - - - Market profile - - - - - - Color rectangle range 1 - цвет прямоугольника 1 диапазона свечей Color rectangle range 2 - цвет пр
Angry bull Option Binary
Fabio Oliveira Magalhaes
1 (1)
Angry Bull Option Binary   This is a Binary Options robot, which contains 7 strategies, you can backtest it to check what the best strategies are Settings Initial Batch Value Dynamic Investment = If activated it will use an automatic lot according to its capital Balance ($) w/ backtest = Starting balance to backtest PorcRiscoInvestment = It will be the value of % for the automatic lot if it is activated Expiration (in minutes) = It will be the expiration time of orders in Binary Options Ma
Die Einzigartigkeit dieses Indikators liegt im Volumenabrechnungsalgorithmus: Die Akkumulation erfolgt direkt für den ausgewählten Zeitraum ohne Bezug auf den Tagesbeginn. Die letzten Balken können aus der Berechnung ausgeschlossen werden, dann haben die aktuellen Daten weniger Einfluss auf die vorher gebildeten signifikanten Niveaus (Volumina). Für eine genauere Berechnung werden standardmäßig Daten aus dem M1-Diagramm verwendet. Der Verteilungsschritt der Preismengen ist geregelt. Standardmäßi
Meta Sniper
Samir Tabarcia
Requirements Optimized to work with   EURUSD-EURCHF-USDJPY, AUDUSD-CADJPY-AUDNZD, CHFJPY-NZDJPY-NZDUSD For timeframe 4H. *(Minimum recommended deposit is $300 for each Pair) for initial lot set to 0.10, My favorite Pair are (CHFJPY-NZDJPY-EURUSD-AUDNZD-USDJPY) Warning it will be SALE only 5 Copys at 60$ Then it will be update up to 200$  You can use it the way it is, For new Set Files will be add on (Comments) ECN broker with low spread is recommended to get better results. Setup is
This panel is a part of the SupDem-Pro trading system and is used to search for the best opportunities for any available instruments. Which can be selected manually in the Market Watch (open it with CTRL + M). Using this trading panel in combination with ShvedSupDem-Pro_Zone allows to analyze multiple currency pairs with a single click. The panel allows to load any instruments from the Market Watch, from 6 major currency pairs up to all instruments (480). The indicator parameters Button Width
Käufer dieses Produkts erwarben auch
Trade Assistant MT4
Evgeniy Kravchenko
4.43 (180)
Sie hilft bei der Berechnung des Risikos pro Handel, der einfachen Einrichtung einer neuen Order, der Orderverwaltung mit Teilschließungsfunktionen, Trailing-Stop von 7 Typen und anderen nützlichen Funktionen. Achtung, die Anwendung funktioniert nicht im Strategietester. Manual, Description, Download demo Linienfunktion Zeigt auf dem Chart die Eröffnungslinie, Stop Loss, Take Profit. Mit dieser Funktion ist es einfach, eine neue Order einzurichten und ihre zusätzlichen Eigenschaften vor der
Forex Trade Manager MT4
InvestSoft
4.98 (375)
Willkommen beim Trade Manager EA – dem ultimativen Risikomanagement-Tool , das den Handel einfacher, präziser und effizienter gestaltet. Dies ist mehr als nur ein Werkzeug zur Orderausführung; es ist eine umfassende Lösung zur Handelsplanung, Positionsverwaltung und Risikokontrolle. Ob Anfänger, erfahrener Trader oder Scalper, der schnelle Ausführungen benötigt – Trade Manager EA passt sich Ihren Anforderungen an und bietet Flexibilität in allen Märkten, von Forex und Indizes bis hin zu Rohstof
Local Trade Copier EA MT4
Juvenille Emperor Limited
5 (81)
Erleben Sie außergewöhnlich schnelles Trade Copying mit dem Local Trade Copier EA MT4 . Mit seiner einfachen 1-Minuten-Setup können Sie Trades zwischen mehreren MetaTrader-Terminals auf demselben Windows-Computer oder Windows VPS mit blitzschnellen Kopiergeschwindigkeiten von unter 0.5 Sekunden kopieren. Ob Anfänger oder professioneller Trader - der Local Trade Copier EA MT4 bietet eine Vielzahl von Optionen, um ihn an Ihre spezifischen Bedürfnisse anzupassen. Es ist die ultimative Lösung für
Custom Alerts MT4
Daniel Stein
5 (1)
Custom Alerts ist ein vielseitiges Multi-Market-Monitoring-Tool, das vielversprechende Setups für alle acht Hauptwährungen (USD, CAD, GBP, EUR, CHF, JPY, AUD und NZD) sowie GOLD (XAU), alle 28 Devisen- und GOLD-Paare, die auf diesen Währungen basieren, und bis zu sieben Indizes wie US30, UK100, WTI, Bitcoin usw. identifiziert. Es ist vollständig anpassbar. Das Tool sammelt Daten von unseren Indikatoren FX Power, FX Volume und IX Power und benachrichtigt Sie bei wichtigen Ereignissen.   Bevor
Exp COPYLOT CLIENT for MT4
Vladislav Andruschenko
4.69 (62)
Handelskopierer für MetaTrader 4. Er kopiert Devisengeschäfte, Positionen und Bestellungen von beliebigen Konten. Es ist eines der besten Handelskopiergeräte  MT4 - MT4, MT5 - MT4 für die Version COPYLOT MT4  (oder MT4 - MT5 MT5 - MT5 für die Version COPYLOT MT5 ). MT5-Version Gesamte Beschreibung   +DEMO +PDF Wie kauft man Wie installiert man     So erhalten Sie Protokolldateien     So testen und optimieren Sie     Alle Produkte von Expforex Kopiererversion für das MetaTrader 5- Terminal
The product will copy all telegram signal to MT4   ( which you are member  ) , also it can work as remote copier.  Easy to set up, copy order instant, can work with almost signal formats, image signal, s upport to translate other language to English Work with all type of channel or group, even channel have "Restrict Saving Content", work with  multi channel, multi MT5 Work as remote copier: with signal have ticket number, it will copy exactly via ticket number. Support to backtest signal. How to
Der MT4 to Telegram Signal Provider ist ein benutzerfreundliches, vollständig anpassbares Tool, das das Senden von Handelssignalen an Telegram ermöglicht und Ihr Konto in einen Signalanbieter verwandelt. Das Format der Nachrichten ist vollständig anpassbar! Für eine einfache Nutzung können Sie jedoch auch eine vordefinierte Vorlage wählen und spezifische Teile der Nachricht aktivieren oder deaktivieren. [ Demo ]   [ Handbuch ] [ MT5-Version ] [ Discord-Version ] [ Telegram-Kanal ] Einrichtung
Trade Dashboard MT4
Fatemeh Ameri
5 (38)
Tired of complex order placement and manual calculations? Trade Dashboard is your solution. With its user-friendly interface, placing orders becomes effortless, by a single click, you can open trades, set stop loss and take profit levels, manage trade lot size, and calculate risk to reward ratios, allowing you to only focus on your strategy. Say goodbye to manual calculations and streamline your trading experience with Trade Dashboard. Download  Demo Version  right now. You can find  Details
TradePanel MT4
Alfiya Fazylova
4.9 (86)
Trade Panel ist ein multifunktionaler Handelsassistent. Die Anwendung enthält mehr als 50 Funktionen für den manuellen Handel und ermöglicht Ihnen die Automatisierung der meisten Handelsaktionen. Vor dem Kauf können Sie die Demoversion auf einem Demokonto testen. Demo hier . Vollständige Anweisungen hier . Handel. Ermöglicht Ihnen die Durchführung grundlegender Handelsvorgänge mit einem Klick: Ausstehende Aufträge und Positionen öffnen. Offenes Raster von Aufträgen. Schließen ausstehender Aufträ
Trade copier MT4
Alfiya Fazylova
4.52 (29)
Trade Copier ist ein professionelles Dienstprogramm zum Kopieren und Synchronisieren von Trades zwischen Handelskonten. Das Kopieren erfolgt vom Konto / Terminal des Lieferanten auf das Konto / Terminal des Empfängers, das auf demselben Computer oder vps installiert ist. Vor dem Kauf können Sie die Demoversion auf einem Demokonto testen. Demoversion hier . Vollständige Anweisungen hier . Hauptfunktionalität und Vorteile: Unterstützt das Kopieren von MT4> MT4, MT4> MT5, MT5> MT4, einschließlich M
Grid Manual MT4
Alfiya Fazylova
4.72 (18)
Grid Manual ist ein Trading-Panel zum Arbeiten mit einem Raster von Orders. Das Dienstprogramm ist universell, verfügt über flexible Einstellungen und eine intuitive Benutzeroberfläche. Es arbeitet mit einem Raster von Aufträgen nicht nur in Richtung Verlust, sondern auch in Richtung steigender Gewinne. Der Händler muss kein Orderraster erstellen und pflegen, all dies wird von "Grid Manual" erledigt. Es genügt, eine Order zu eröffnen und das "Grid Manual" erstellt automatisch ein Orderraster daf
News Trapper EA
Noha Mohamed Fathy Younes Badr
4.86 (14)
Hi, all.  News trapper EA It is an expert for trading news very safe expert  Automated Trading on the news of the economic calendar. It shows stable trading during last 10  years. EA doesn't use dangerous technologies like martingale, grid. The Expert is very simple to use.      sale will end after 48 h how to install it     and set files     read the blog         after purchase contact me to add you to   VIP   channel  The program contains flexible settings for trading on the news of the econ
Summer 40% discount ($149 -> $88) Everything for chart Technical Analysis indicator mt4 in one tool Draw your supply demand zone with rectangle and support resistance with trendline and get alerts to mobile phone or email alert -  Risk reward indicator Video tutorials, manuals, DEMO download   here .  Find contacts on my   profile . 1.   Extended rectangles and trendlines Object will be extended to the right edge of the chart when price will draw new candles on chart. This is rectangle extend
Telegram To MT4 Receiver
Levi Dane Benjamin
5 (3)
Kopieren Sie Signale von jedem Kanal, dem Sie angehören (einschließlich privater und eingeschränkter Kanäle) direkt auf Ihren MT4.  Dieses Tool wurde mit dem Benutzer im Hinterkopf entwickelt und bietet viele Funktionen, die Sie benötigen, um die Trades zu verwalten und zu überwachen. Dieses Produkt wird in einer benutzerfreundlichen und visuell ansprechenden grafischen Benutzeroberfläche präsentiert. Passen Sie Ihre Einstellungen an und starten Sie die Nutzung des Produkts innerhalb weniger Mi
On the occasion of the first days of publishing and attracting first customers, a 50% discount $120 for first 10 user (3 license left) Next price is $160 > $200 > $240 Don't forget to send a message after buying (not renting) to add you to our VIP group for free. Live OrderBoook, Another high-level tool by Ziwox Order Book An order book is an electronic list of buy and sell orders for a specific asset, organized by price level. It provides real-time data on market depth, showing the amount o
Comprehensive on chart trade panel with the unique ability to be controllable from mobile as well. Plus has a library of downloadable configuration, e.g. exit rules, extra panel buttons, pending order setup and more. Please see our product video. Works with all symbols not just currency pairs. Features On chart panel plus controllable from free app for Windows, iPhone and Android Built-in script engine with library of downloadable configuration, e.g. add 'Close All Trades in Profit' button, exit
The Expert Advisor will help you forward all pop-up alert with screenshot from  MetaTrader 4 to Telegram channel/ group, also forward all notifications to Telegram. Parameters  -  Telegram Bot Token - create bot on Telegram and get token.  -  Telegram Chat ID  - input your Telegram user ID,  group / channel ID  -  Forward Alert - default true, to forward alert.  -  Send message as caption of Screenshot - default false, set true to send message below Screenshot  How to setup and guide  - Telegram
Trade Manager MT4 DaneTrades
Levi Dane Benjamin
4.33 (9)
Trade Manager, der Ihnen hilft, Geschäfte schnell ein- und auszusteigen und gleichzeitig Ihr Risiko automatisch zu berechnen. Einschließlich Funktionen, die Ihnen helfen, Over Trading, Revenge Trading und Emotional Trading zu verhindern. Trades können automatisch verwaltet werden und die Kontoleistungskennzahlen können in einem Diagramm visualisiert werden. Diese Funktionen machen dieses Panel ideal für alle manuellen Händler und tragen zur Verbesserung der MetaTrader 4-Plattform bei. Unterstütz
TPSpro Trade PRO
Roman Podpora
5 (4)
DEMOVERSION HERUNTERLADEN ANWEISUNGEN -       https://www.mql5.com/ru/blogs/post/758419 IM TESTMODUS             (im Tester) Panel-Funktionalität             NICHT AKTIV       Wir haben lediglich eine visuelle Darstellung des Panels selbst bereitgestellt. Ein Tool, das die Positionsgröße oder das Risiko basierend auf einem bestimmten Stop-Loss-Level sofort berechnen kann, ist sowohl für professionelle als auch für unerfahrene Händler von entscheidender Bedeutung. Das Handelsdienstprogramm TRA
VirtualTradePad mt4 Extra
Vladislav Andruschenko
4.88 (57)
Trading Panel für den Handel mit 1 Klick.  Arbeiten mit Positionen und Aufträgen!  Handeln vom Chart oder von der Tastatur. Mit unserem Trading-Panel können Sie mit einem Klick vom Chart aus handeln und Handelsoperationen 30-mal schneller ausführen als die Standard-MetaTrader-Steuerung. Automatische Berechnungen von Parametern und Funktionen, die einem Händler das Leben erleichtern und einem Händler helfen, seine Handelsaktivitäten viel schneller und bequemer durchzuführen. Grafische Tipps und
BBMA Oma Ally Signals Scanner (BBMA Oma Ally Analyzer Dashboard EA) This is a multi-pair and multi scanner dashboard to find the key signal of BBMA Oma Ally Strategy BBMA consists of the use of 2 indicators: Moving Averages Bollinger Bands BBMA consists of many types of entries: Reentry Extreme Rejection EMA50 GAP (EMA50 to Upper/Lower BB) MHV Full Setup (CSE>TPW>MHV>Direction>Reentry) There are many multi timeframe signals based on this strategy. RRE (Reentry - Reentry - Extreme) REE (Reentry
Trade Sync MT4
Anna Kolchina
5 (1)
« Trade Sync » — Really fast copying and precise synchronization of trades. Simple installation and configuration of the application within 5 seconds allows you to copy trades between different MetaTrader terminals installed on one Windows PC or Windows VPS at maximum speed. «Trade Sync» contains a large number of options for customizing the application to your specific needs and allows you to cope with even complex user tasks. Separate use: Trade Sync MT4 - allows you to copy (Мt4 > Мt4), Trade
EA Hedger
Sergej Chukhista
4.67 (3)
EA Hedger   ist ein professionelles Trading-Dienstprogramm mit vielen Einstellungen, mit dem Sie Risiken durch Hedging verwalten können. Hedging ist eine Handelstechnik, bei der entgegengesetzte Positionen zu den bereits offenen Positionen eröffnet werden. Mit Hilfe von Hedging kann die Position ganz oder teilweise gesperrt (gesperrt) werden. Warum lohnt es sich, dieses Produkt zu kaufen: Zuverlässigkeit   - der Berater ist gründlich geprüft und getestet Nützlichkeit   - der Expert Advisor wi
Layer Master Toolbox
Peter Andrew Thomas
5 (3)
GRID TRADING - Layer Master tool kit is the ultimate, easy to use trading toolkit makes it simple to layer grids of Orders over any entry level. This toolkit will make it simple and fast to Open / Enter and Manage your grid trades on MT4. Every function is simple - but clicking and dragging the order zone - you define an area you want your orders, then you can quickly drag the SL and TP levels to where you want them. Hit one button and your orders are sent!!!  Features: It is capable to send h
MT4 To Telegram Sender
Levi Dane Benjamin
3.5 (4)
Senden Sie vollständig anpassbare Signale von MT4 an Telegram und werden Sie zum Signalanbieter! Dieses Produkt wird in einer benutzerfreundlichen und visuell ansprechenden grafischen Benutzeroberfläche präsentiert. Passen Sie Ihre Einstellungen an und beginnen Sie innerhalb weniger Minuten mit der Nutzung des Produkts! Benutzerhandbuch + Demo  | MT5 Version  | Discord Version Wenn Sie eine Demo ausprobieren möchten, besuchen Sie bitte das Benutzerhandbuch. Der MT4 an Telegram Sender funktioni
Smart Copy Local MT4
Kyra Nickaline Watson-gordon
5 (7)
Smart Copy is an Easy-to-Use EA that supports Multi Copying Metatrader4 and Metatrader5 and Local/Remote Copying. (Remote Version is coming soon) Free version is available on Smart Copy Local Free MT4 Specifications :     Real Time, Multi Terminal - Multi Account - MT4/MT5 trade copying     Copy from netting to hedge and hedge to netting is supported.     Fast and instant copy     All settings are input visually.     Easy modifying symbol names, prefix, suffix     Enable/Disable co
The product will copy all  Discord  signal   to MT4   ( which you are member  ) , also it can work as remote copier.  Easy to set up. Work with almost signal formats, support to translate other language to English Work with multi channel, multi MT4. Work with Image signal. Copy order instant, auto detect symbol. Work as remote copier: with signal have ticket number, it will copy exactly via ticket number. How to setup and guide: Let read all details about setup and download Discord To MetaTrade
Übernehmen Sie die Kontrolle über Ihr Forex-Portfolio. Sehen Sie sofort, wo Sie stehen, was funktioniert und was Ihnen Schmerzen bereitet! MT5-VERSION HIER VERFÜGBAR: https://www.mql5.com/en/market/product/58658 Das Trade Manager Dashboard soll Ihnen auf einen Blick zeigen, wo sich jede Ihrer Positionen auf dem Devisenmarkt derzeit befindet, und das Risikomanagement und das Engagement in Währungen verständlicher machen. Für Händler, die schrittweise mit mehreren Positionen oder diesen Trading
Ultimate Trade Copier
BLAKE STEVEN RODGER
5 (1)
This trade copy utility allows you to instantly and seamlessly replicate and synchronize unlimited orders from multiple master accounts to multiple slave accounts on your local machine. You can create custom channels (or portfolios) with advanced filtering capabilities to copy from multiple master accounts to multiple slave accounts. Moreover, you can tailor these channels with a range of lot sizing and trade condition options to ensure that copied trades outperform the original source. You can
Kopierer->Interaktion mit der Benutzeroberfläche ->>>>Empfohlen für den Einsatz auf Windows-Computern oder VPS Windows Grundfunktionen: Die Geschwindigkeit der Copy-Trading-Interaktion beträgt weniger als 0,5 Sekunden 95 % der Symbole auf verschiedenen Plattformen (Sonderfälle wie unterschiedliche Suffixe) werden automatisch abgeglichen, grundsätzlich sind keine manuellen Einstellungen erforderlich 4 Lot-Berechnungsmodi, die je nach Signalquelle eingestellt werden können Mehrere Plattformen, me
Weitere Produkte dieses Autors
The indicator is designed to detect range market or consolidation areas on the chart. It does this by using the market volatility and price momentum. The indicator signals the start and stop of the range with icons on the chart and various  type of alerts options provided in the input settings. Usage: The indicator can be used to check the state of the market i.e. trending or ranging to make appropriate decision and use strategies designed for specific market state. Please see the attached video
ZigZag New
Navdeep Singh
5 (1)
Informative & optimized Zigzag, Accumulated volume, Price change   A rewrite of the traditional zigzag tool with new additions. Features:- Optimized code Displays accumulated volume between peaks Displays price change between peaks Usage:- Identify trend swings Identify high volume swings Compare price changes between swings Drawing Fibonacci tool on strong price change or high volume swings
FREE
Renko bars builder
Navdeep Singh
5 (4)
The indicator builds a Renko chart in the sub window for the current symbol. The bars are formed from live data and the desired bar size can be set in the inputs tab. Most importantly, because the Renko chart only uses price to construct bars and ignores time, the indicator can be applied to any time frame and same results can be achieved. Recommended usage As Renko charts are famous for eliminating noise so traders can use this tool to see clear picture of the trend to help their analysis, ent
FREE
RSI Scanner, Multiple Symbols and Timeframes, Graphical User Interface An indicator that scans multiple symbols added from the market watch and timeframes and displays result in a graphical panel. Features: Multi symbol Multi timeframe Alerts and Notifications Live Monitoring Sorting modes One click to change symbol and timeframe Inputs for RSI and scanner settings
FREE
ADR Bands
Navdeep Singh
4.5 (2)
Average daily range, Projection levels, Multi time-frame ADR bands shows levels based on the selected time-frame. Levels can be used as projections for potential targets, breakouts or reversals depending on the context in which the tool is used. Features:- Multi time-frame(default = daily) Two coloring modes(trend based or zone based) Color transparency  
FREE
The indicator helps the trader in identifying potential liquidity levels. The algorithm used in this indicator checks the behavior of the asset taking into account the price levels, momentum and volume analysis. Features:- Parameters for signal optimization and alerts. Usage:- The levels formed by the indicator can be helpful to traders in identifying potential entries, breakouts or reversals. it can assist traders of technical trading background or even pure price action trading.
Algorithmic Signals indicator   is not an indicator but a strategy that generates entry/exit signals. The entry arrows are formed after multiple conditions are met. The indicator is using an   Adaptive Algorithm   which automatically adjust to the symbol and time frame (see the screenshots below) . Signals can be used for scalping or even trend trading. Main features:- Non repainting signals Entry signals Exit signals Alert for price reaching 1 x ATR(14) (could be utilized for initial take prof
Stochastic force is an advanced version of the stochastic oscillator. Instead of using the regular price a more efficient price data is provided as an input for the oscillator which takes into account the price efficiency, volume and market noise. Also price is pre-filtered with the selected average type and then post-filtered by a hull moving average which provides a smooth transition of the oscillator. It eliminates maximum false signals and has the potential to become an integral part of any
This is the new version of the Algorithmic signals featuring a new algorithm. It is a blend of technical and candlestick analysis. Candlestick analysis are often ignored while creating technical strategies but this version has a feature to include that and make confirmations more strong.  Usage:- Traders can use the signals for buying and selling assets or even blend their own favorite indicators with it.
TDI Signals generates buy and sell arrows based on a TDI(Traders Dynamic Index) algorithm. It looks for price breakouts, continuations and reversals. By default it runs in the trend mode but user is provided with the option to change that to reversal mode. Trader can use the mode which compliments his/her trading style.  Usage:-   TDI Signals can be used as a stand alone indicator with context or even be added to strategies to make confirmations more strong. Volatility based stop loss, take pr
RSI Levels generates buy and sell arrows based on RSI analysis. Signals are based on extreme levels breakouts and can be further filtered by a volatility metric. Trader can use the mode which compliments his/her trading style.  Features:- Parameters for signal optimization and alerts. Usage:-   RSI Levels can be used as a stand alone indicator with context or even be added to strategies to make confirmations more strong. Volatility based stop loss, take profit & position sizing can be very helpf
The indicator helps the trader in identifying potential liquidity levels. The algorithm used in this indicator checks the behavior of the asset taking into account the price levels, momentum and volume analysis. Features:- Parameters for signal optimization and alerts. Usage:- The levels formed by the indicator can be helpful to traders in identifying potential entries, breakouts or reversals. it can assist traders of technical trading background or even pure price action trading. Examples o
Step force index is a modified version of the famous force index indicator. As the name suggests it incorporates a step feature to filter the force index values thus eliminating small fluctuations in the indicator. It also utilizes the smooth algorithm library thereby providing multiple smoothing options for the index values. This personal implementation makes it a more easy to use and a reliable tool. Main features A wide range of parameters for signals optimization Alerts, emails and push noti
CMA dashboard is designed to help traders in identifying trend on multiple timeframes and symbols. It displays a clear state of the overall trend at one place without the need to navigate between different charts and timeframes. This saves time and makes decision making process fast so that potential opportunities are not missed. It is based on Corrected moving averages available here Features Parameters for signal optimization Inputs for multiple timeframes and symbols  Usage Higher timeframe
IBB Candles is a tool that is based on the concept of Inverse Bollinger Bands. It compares price relative to state of the bands and plots candles with different colors defining the current state of the market i.e range | trend | strong trend. As the name suggests IBB(Inverse Bollinger Bands) is a technique which is completely different from the traditional Bollinger Bands and proves to be much more effective in analyzing market. This personal implementation makes this tool a more reliable option
Market structures, Market balance, Range breakouts This tools helps to identify areas of market ranges, structures and plots colored boxes on breakout of those areas. User is given the option to receive alerts and notifications on the formation of the blocks. The tool has the ability to become an essential part of a technical trading system or even pure price action trading. Usage:- An essential tool for price action or technical traders.  More information in the blog
Horizontal volume bars, Cluster analysis, Volume profile Volume in Range gets information about the accumulated volume in a specified vertical range and period in bars. The received data is then plotted on the chart as rectangular boxes with the volume quantity inside. Usage:- The tool acts as a support resistance levels but most importantly it should be used to check in which direction the price breaks out of the significant levels formed by this indicator and then actions to be taken on correc
Price breakouts, Levels, Multi-time frame Inside bars checks for price failure to break from the previous high/low and on breakout draws a breakout box on the chart. The choice of breakout price is given to the user i.e. close or high/low of bar. Alerts can be received on breakouts. Features:- Multi-time frame Alerts, notifications & emails Usage:- Breakout signals Check how price action is evolving with the help of boxes Get multi-time frame bias
Market Fractal Analysis, Fractal Swing, Market Flow Fractal Cycles looks for Similar Patterns in the Market that repeat themselves because of the Market Fractal Nature. These patterns are displayed with help of Graphical Objects and Alerts can be received on their arrival. Read the Blog for full information. Features:- Auto Detection of Patterns Customization for Color and Line Styles Alerts, Emails & Push Notifications 
50+ Candlestick Patterns, Simulated Trading Results, Top Five Performers Candle Analysis extends Candlesticks Pattern Analysis by not only identifying Patterns but also recording the Past Performance of the Patterns. What it Does:- Identifies and plots results on chart Displays Top Patterns for both Bullish and Bearish type.  Log can be printed in experts tab to see Simulated Trading results Displays All or Selected Patterns Alerts on Pattern formation More detailed information in Blog
Stochastic force is an advanced version of the stochastic oscillator. Instead of using the regular price a more efficient price data is provided as an input for the oscillator which takes into account the price efficiency, volume and market noise. Also price is pre-filtered with the selected average type and then post-filtered by a hull moving average which provides a smooth transition of the oscillator. It eliminates maximum false signals and has the potential to become an integral part of any
IBB Candles is a tool that is based on the concept of Inverse Bollinger Bands. It compares price relative to state of the bands and plots candles with different colors defining the current state of the market i.e range | trend | strong trend. As the name suggests IBB(Inverse Bollinger Bands) is a technique which is completely different from the traditional Bollinger Bands and proves to be much more effective in analyzing market. This personal implementation makes this tool a more reliable optio
Horizontal volume bars, Cluster analysis, Volume profile Volume in Range gets information about the accumulated volume in a specified vertical range and period in bars. The received data is then plotted on the chart as rectangular boxes with the volume quantity inside. Usage:- The tool acts as a support resistance levels but most importantly it should be used to check in which direction the price breaks out of the significant levels formed by this indicator and then actions to be taken on correc
Market structures, Market balance, Range breakouts This tools helps to identify areas of market ranges, structures and plots colored boxes on breakout of those areas. User is given the option to receive alerts and notifications on the formation of the blocks. The tool has the ability to become an essential part of a technical trading system or even pure price action trading. Usage:- An essential tool for price action or technical traders.  More information in the blog
Market Fractal Analysis, Fractal Swing, Market Flow Fractal Cycles looks for Similar Patterns in the Market that repeat themselves because of the Market Fractal Nature. These patterns are displayed with help of Graphical Objects and Alerts can be received on their arrival. Read the   Blog   for full information. Features:- Auto Detection of Patterns Customization for Color and Line Styles Alerts, Emails & Push Notifications
50+ Candlestick Patterns, Simulated Trading Results, Top Five Performers Candle Analysis extends Candlesticks Pattern Analysis by not only identifying Patterns but also recording the Past Performance of the Patterns. What it Does:- Identifies and plots results on chart Displays Top Patterns for both Bullish and Bearish type.  Log can be printed in experts tab to see Simulated Trading results Displays All or Selected Patterns Alerts on Pattern formation More detailed information in   Blog
Auswahl:
Keine Bewertungen
Antwort auf eine Rezension