Renko Pro 5
- Indikatoren
- Kaijun Wang
- Version: 3.9
- Aktualisiert: 2 Mai 2023
- Aktivierungen: 5
Ziegeldiagramm – eine alternative Handelsmethode
Wenn Sie ein Trader sind, der von den Candlesticks in unzähligen Charts verwirrt ist oder nicht wissen, wie man Linien oder Unterstützungs- und Widerstandslinien zeichnet, sollten Sie eine andere Handelsmethode finden, die zu diesem Zeitpunkt zu Ihnen passt. So wie ein Fahrer nach wiederholten Problemen für eine vollständige Überholung anhält, gilt dies auch für eine Transaktion.
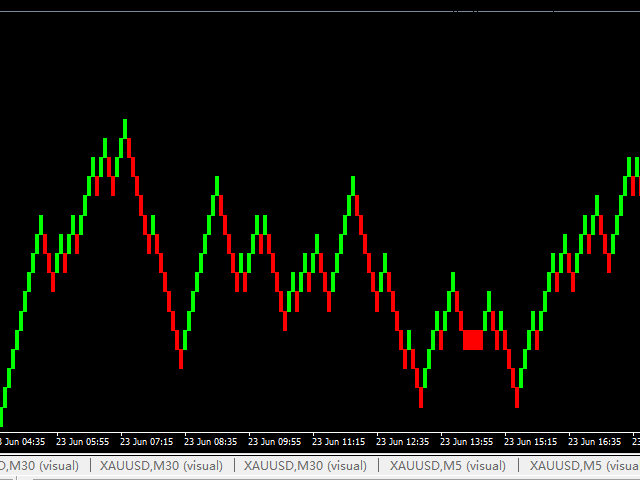
Der Brick-Chart stellt eine einfache Handelsmethode für Intraday-Trader dar. Tatsächlich hat diese Methode die gleiche Geschichte wie die K-Linie und stammt ebenfalls aus Japan.
Um einen Brick-Chart zu definieren, beschreiben sie nur den Preistrend eines Set-Points oder Basis-Points. Zum Beispiel kann ein 10-Punkte-Brick-Chart nur einen 10-Punkte-Aufwärtstrend oder einen 10-Punkte-Abwärtstrend bei Preisänderungen darstellen.
Das Brick-Diagramm hat den einzigartigen Vorteil, dass sein Preis nicht an die Zeit gebunden ist, dh erst wenn die Preisänderung den eingestellten Wert erreicht, erscheint ein neues Brick-Diagramm und das Brick-Diagramm entfernt den Preis Burr, so dass es sehr angenehm von den sinnen.