TT Macd Dashboard
- Indikatoren
- Tomislav Turcin
- Version: 1.0
- Aktivierungen: 5
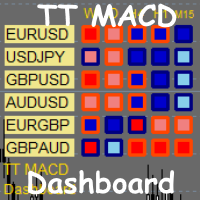
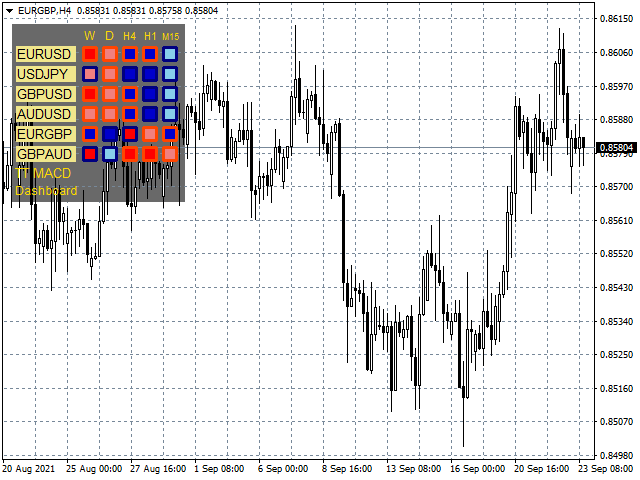
TT MACD Dashboard is multi-time frame and multi-currency market scanner.
It is telling you the value of MACD and MACD histogram (a difference between MACD line and Signal line) in a form of small rectangle.
If MACD value is above zero (MACD is bullish). Rectangle border color is bullish (Navy by default).
If MACD value is below zero (MACD is bearish). Rectangle border color is bearish (OrangeRed by default).
If MACD histogram is rising and above zero (Bullish histogram). Rectangle color is bullish color (MediumBlue by default).
If MACD histogram is falling and above zero (Bullish retracement histogram). Rectangle color is bullish retracement color (SkyBlue by default).
If MACD histogram is falling and below zero (Bearish histogram). Rectangle color is bearish color (Red by default).
If MACD histogram is rising and below zero (Bearish retracement histogram). Rectangle color is bearish retracement color (LightCoral by default).
A user can change all colors, the frequency of checks, checked instruments and time frames, and MACD indicator parameters.
