• Übersicht
  • Bewertungen
  • Diskussion (1)
  • Neue Funktionen

Top and bottom patterns

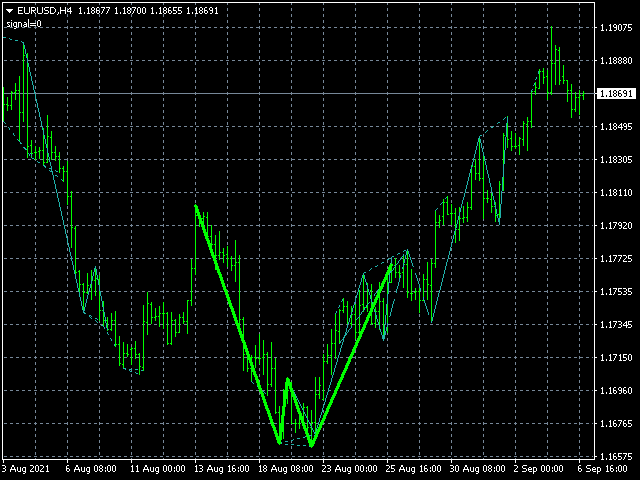
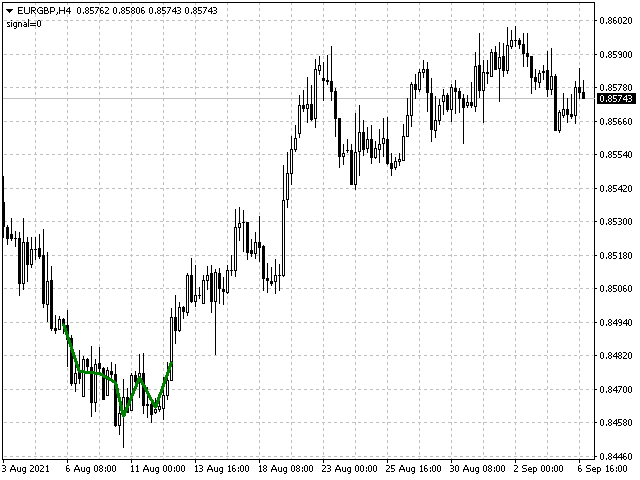
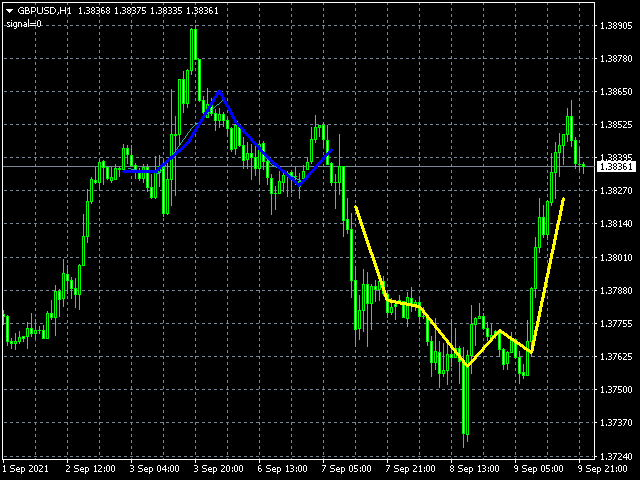
Dieser Indikator findet Umkehrmuster der technischen Analyse wie Double Bottom, Triple Bottom, Head & Shoulders und ihre entgegengesetzten Gegenstücke. Der Indikator zeigt sie auf dem Chart eines Währungspaares an und kann einem Händler signalisieren, ob sich kürzlich ein Muster gebildet hat. Auf diese Weise können Sie schnell eine mögliche Trendumkehr oder -korrektur erkennen, es reicht aus, dem Chart einen Indikator hinzuzufügen, danach können Sie verschiedene Zeitrahmen ändern, um solche Muster schnell zu finden, wenn die Muster nicht lokalisiert sind oder im Gegenteil, sich nicht an den besten Stellen in der Geschichte befinden, können Sie die Parameter für eine bessere Anzeige für ein bestimmtes Währungspaar ändern. Außerdem können Sie die Farbe der Linien der angezeigten Muster ändern und die Anzeige von Linien nicht vollständig geformter Muster aktivieren.

Optionen

  • History - die Anzahl der Balken, um nach Mustern im Chart zu suchen;
  • ExtremCountBars - Die Anzahl der Balken, um nach Extremwerten zu suchen, zum Beispiel Hochs beim 2. Peak (3-40 wird empfohlen);
  • MinExtremDist - Die minimale Anzahl von Balken zwischen 2 Extremwerten (2-12 wird empfohlen, je höher der Wert, desto größer die Größe des gefundenen Musters);
  • MaxExtremDist - Maximale Anzahl von Balken zwischen 2 Extremwerten (10-50 wird empfohlen);
  • MultipleVerticesFilter - Filtern, um "zusätzliche" Hochs oder Tiefs zu finden (wenn aktiviert, sollte es nur 2 Hochs oder Tiefs geben);
  • PeriodMAforEdgeFiltering - Filtern der Kanten von doppelten unteren und oberen Formen nach MA, so dass es einen sanften Anstieg oder Abfall gibt (0 - aus, 0-10 wird empfohlen);
  • PriceDeviationsParam - Die maximale Preisabweichung (abhängig von der Volatilität) eines Währungspaares von zwei Extremen (je größer dieser Wert, desto mehr kann sich die Zahl als Kurve herausstellen, wird aber häufiger gefunden);
  • PriceChangeBefore - Wie viel der Wert der Preisänderung vor dem Muster kleiner sein sollte als die Größe des Musters selbst (empfohlen von 1 bis 2,5);
  • MaxPriceStrengthAfterPattern – Ein Parameter zum Erhöhen (und Verringern) der maximalen Kursabweichung vom Muster (z. B. 1,5 = 1,5 größer als die Mustergröße);
  • SelfTuningParametersCount - Die Anzahl der Versuche zur automatischen Einstellung von Parametern (wie oft die Parameterwerte geändert werden können, um nach mindestens 1 Ziffer zu suchen, es wird empfohlen 0-10, 0 - die automatische Einstellung der Parameter ist deaktiviert);
  • PeriodMAforHeadS - Periode des gleitenden Durchschnitts zum Zeichnen der Figur "Kopf und Schultern" (und der invertierten Version), 0 - das Muster ist ausgeschaltet, 2-10 wird empfohlen (je höher der Wert, desto größer kann die Größe des gefundenen Musters sein) Sein);
  • DrawUnfinishedPatterns - Unfertige Muster zeichnen (Linien auf dem Diagramm, die zeigen, dass ein Muster gebildet worden sein könnte);
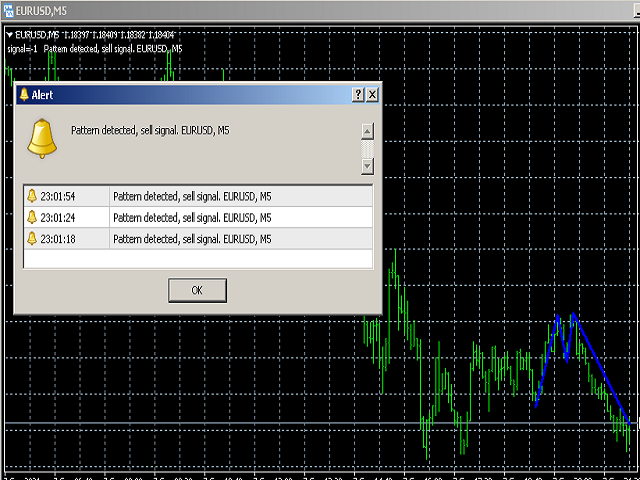
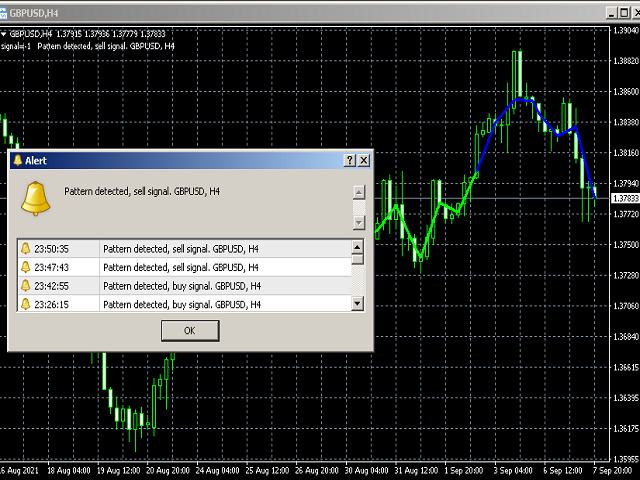
  • EnableAlert - aktiviert Warnungen, wenn ein Muster erscheint und ausbricht;
  • AlertPeriodBars - Die Anzahl der Balken, nach denen die Warnung erneut erscheinen kann;
  • MaximumFigureShiftForAlert - Maximaler Abstand der Figur vom aktuellen Balken für das Erscheinen der Warnung;
  • NeutralLinesClr - Farbe der neutralen Linien (wird angezeigt, wenn der Parameter DrawUnfinishedPatterns aktiviert ist);
  • FinalBuyPatternClr - Linienfarbe der abgeschlossenen Kaufform;
  • FinalSellPatternClr - Linienfarbe der fertigen Verkaufsform.

Empfohlene Produkte
Master Scalping M1 ist ein innovativer Indikator, der einen Algorithmus verwendet, um den Trend schnell und genau zu bestimmen. Der Indikator berechnet den Zeitpunkt zum Öffnen und Schließen von Positionen, die Indikatoralgorithmen ermöglichen es Ihnen, die idealen Zeitpunkte für den Einstieg in einen Handel (Kauf oder Verkauf eines Vermögenswerts) zu finden, was den Erfolg von Transaktionen für die meisten Händler erhöht. Vorteile des Indikators: Einfach zu bedienen, überladen Sie das Diagramm
An indicator of pattern #31 ("Long Island") from Encyclopedia of Chart Patterns by Thomas N. Bulkowski. The second gap is in the opposite direction. Parameters: Alerts - show alert when an arrow appears   Push - send a push notification when an arrow appears (requires configuration in the terminal) GapSize - minimum gap size in points ArrowType - a symbol from 1 to 17 ArrowVShift - vertical shift of arrows in points   ShowLevels - show levels ColUp - color of an upward line ColDn - color of
This is a new strategy for SUPPLY DEMAND areas It is based on a calculation using the tick volume to detect the big price action in market for both bear /bull actions this smart volume action candles are used to determine the supply and demand areas prices in between main supply and demand lines indicate sideway market  up arrows will be shown when prices moves above the main supply and the secondary supply lines Down arrows will be shown when prices moves below the main demand and the secondary
Daily Candle Predictor ist ein Indikator, der den Schlusskurs einer Kerze vorhersagt. Der Indikator ist in erster Linie für die Verwendung in D1-Charts gedacht. Dieser Indikator eignet sich sowohl für den traditionellen Devisenhandel als auch für den Handel mit binären Optionen. Der Indikator kann als eigenständiges Handelssystem oder als Ergänzung zu Ihrem bestehenden Handelssystem verwendet werden. Dieser Indikator analysiert die aktuelle Kerze und berechnet bestimmte Stärkefaktoren innerhalb
TWO PAIRS SQUARE HEDGE METER INDICATOR Try this brilliant 2 pairs square indicator It draws a square wave of the relation between your two inputs symbols when square wave indicates -1 then it is very great opportunity to SELL pair1 and BUY Pair2 when square wave indicates +1 then it is very great opportunity to BUY pair1 and SELL Pair2 the inputs are : 2 pairs of symbols         then index value : i use 20 for M30 charts ( you can try other values : 40/50 for M15 , : 30 for M30 , : 10 for H1 ,
Infinity Trend Pro
Yaroslav Varankin
1 (1)
This is a trend indicator without redrawing Developed instead of the binary options strategy (by the color of the Martingale candlestick) Also works well in forex trading When to open trades (binary options) A signal will appear in the place with a candle signaling the current candle It is recommended to open a deal for one candle of the current timeframe M1 and M5 When a blue dot appears, open a deal up When a red dot appears, open a trade down. How to open trades on Forex. When a signal is rec
All Symbols   AND  All Time frames Scan                                                                                                                 Document Introduction   The ABCD is a basic harmonic pattern. The ABCD pattern is a visual, geometric chart pattern comprised of three consecutive price swings. It looks like a diagonal lightning bolt and can indicate an upcoming trading opp
This indicator allows to analyze a chart using the rule of supple and demand. You will see zones of sales and purchases and determine the most profitable points to open positions. The indicator is based on the principle of market fractality. Chart zones show places where a strong buyer or seller has made the price reverse and change its direction. The indicator has several types of zones calculation. Color and type of zones displaying are set as desired. The zone width can be displayed in pips.
An indicator of patterns #24, #25, #26 and #27 ("Head and Shoulders", "Complex Head and Shoulders") from Encyclopedia of Chart Patterns by Thomas N. Bulkowski. Parameters: Alerts - show alert when an arrow appears   Push - send a push notification when an arrow appears (requires configuration in the terminal) PeriodBars - indicator period K - an additional parameter that influences the accuracy of pattern shape recognition. The smaller the value is, the smoother the row of peaks/valleys shou
For this set of indicators 1. General information     - Calculates with high performance mathematical algorithms.     - Calculated from the price of candles     - The entry point of this order is filtered by the train EMA and the oscillator.     - Calculate the integrity of the candle 2. How does it work?     - You can see two types of order entry points: the notification on the monitor and the arrow.     - You can trust 75-95 percent of this entry point. 3. Settings     - Retracement is re
>>> BIG SALE PROMOTION: 50% OFF + GIFT EA!  - Promo price: $64 / Regular price $129 <<< - The promotion will end soon! The Forex Trend Tracker is an advanced tool designed to enhance the trading capabilities of forex traders. This sophisticated indicator uses complex mathematical formulas alongside the Average True Range (ATR) to detect the beginnings of new upward and downward trends in the forex market. It offers visual cues and real-time alerts to give traders a competitive advantage in th
Gold Phoenix
Yaroslav Varankin
The perfect tool for Scalng in the Forex markets You can trade both from signal to signal and using take profit  The algorithm does not use Zigzag!  No redrawing!  This is a channel instrument that uses a moving average as a filter. Moving Average  There are 2 parameters for the settings Ma Period = 5 period Moving Average  Channel 1.0 distance of channel lines from the chart Price Signal Filter - calculation of signal opening and filter There is a complete set of Alert There is a multi-timefram
Wave Wolf MT4
Andrei Salanevich
Der MT4 Wave Wold Forex Indikator wurde entwickelt, um Wulff-Wellen zu finden und sie im aktuellen Fenster des Handelsterminals anzuzeigen. Ein ausgezeichneter Indikator für Händler, die Wulff-Wellen im Handel verwenden. Seine Anwendung in Handelsstrategien wird ihre Effizienz und Rentabilität erheblich verbessern. INFORMATIONEN ZUM INDIKATOR Im Gegensatz zu anderen Wolfswellenindikatoren hat der MT4 Wave Wold Forex Indikator eine Reihe von Funktionen, die seine Effizienz erheblich verbessern
Awesome Oscillator by Bill Williams with the ability to fine-tune and replace the averaging algorithms of the indicator, which significantly expands the possibilities of using this oscillator in algorithmic trading and brings it closer in its properties to such an indicator as the MACD. To reduce price noise, the final indicator is processed with an additional Smooth averaging. The indicator has the ability to give alerts, send mail messages and push signals when the direction of movement of th
Quantum Heiken Ashi PRO MT4
Bogdan Ion Puscasu
4.43 (7)
Wir stellen vor       Quantum Heiken Ashi PRO-   Charts Die Heiken-Ashi-Kerzen wurden entwickelt, um klare Einblicke in Markttrends zu geben und sind bekannt für ihre Fähigkeit, Rauschen herauszufiltern und falsche Signale zu eliminieren. Verabschieden Sie sich von verwirrenden Preisschwankungen und begrüßen Sie eine glattere, zuverlässigere Diagrammdarstellung. Was den Quantum Heiken Ashi PRO wirklich einzigartig macht, ist seine innovative Formel, die traditionelle Candlestick-Daten in leicht
Blahtech Market Profile
Blahtech Limited
4.61 (18)
Was: $249  Now: $99   Market Profile defines a number of day types that can help the trader to determine market behaviour. A key feature is the Value Area, representing the range of price action where 70% of trading took place. Understanding the Value Area can give traders valuable insight into market direction and establish the higher odds trade. It is an excellent addition to any system you may be using. Blahtech Limited presents their Market Profile indicator for the MetaTrader community. Ins
VR Cub
Vladimir Pastushak
VR Cub ist ein Indikator für den Erhalt hochwertiger Einstiegspunkte. Der Indikator wurde entwickelt, um mathematische Berechnungen zu erleichtern und die Suche nach Einstiegspunkten in eine Position zu vereinfachen. Die Handelsstrategie, für die der Indikator geschrieben wurde, hat sich seit vielen Jahren bewährt. Ihr großer Vorteil liegt in der Einfachheit der Handelsstrategie, die es auch unerfahrenen Händlern ermöglicht, erfolgreich damit zu handeln. VR Cub berechnet Positionseröffnungspunkt
Gap island
Dmitry Fedoseev
An indicator of pattern #30 ("Island Reversal") from Encyclopedia of Chart Patterns by Thomas N. Bulkowski (two gaps, the second gap is in the direction of the first one). Parameters: Alerts - show alert when an arrow appears   Push - send a push notification when an arrow appears (requires configuration in the terminal) GapSize - minimum gap size in points ArrowType - a symbol from 1 to 17 ArrowVShift - vertical shift of arrows in points   ShowLevels - show levels ColUp - color of an upward lin
Trend Deviation
VLADISLAV AKINDINOV
Trend indicator with calculation of dynamic levels and signaling their intersection. Description of input parameters: StepTF = true; - Calculation of the indicator by closing the bar (true) or by each tick (false) BarsCount = 300; - Number of settlement bars Price = PRICE_CLOSE; - Type of price used TimeFrame = PERIOD_CURRENT; - Estimated timeframe TrendPeriod = 9; - Trend calculation period TrendDeviations = 4.9; - coefficient of deviation PeriodTrendSmooth = 1; - Trend smoothi
Trend Bilio - an arrow indicator without redrawing shows potential market entry points in the form of arrows of the corresponding color: upward red arrows suggest opening a buy, green down arrows - selling. The entrance is supposed to be at the next bar after the pointer. The arrow indicator Trend Bilio visually "unloads" the price chart and saves time for analysis: no signal - no deal, if an opposite signal appears, then the current deal should be closed. It is Trend Bilio that is considered
The Master Figures indicator analyzed the market for the most common chart patterns. The first pattern is called Pin bar . This pattern can rightly be considered one of the most widespread. This pattern looks like a candle with a small body and large tail (wick). Once you see it on the chart, open a position against the wick. It is better to use the resistance lines for closing. Master Figures shows this pattern in the form of circles. A position should be opened when a new candle appears after
Forex Indicator  " Morning  Star  pattern" for MT4 Indicator "Morning Star pattern" is a very powerful indicator for Price Action trading:    No repaint, No delays; Indicator   detects bullish Morning Star patterns on chart:  Blue arrow signal on chart (see pictures) P C, Mobile & Email alerts   are included Also its brother - bearish  " Evening Star pattern" indicator is available (follow the links below) Indicator  " Morning Star pattern"  is excellent to   combine with Support/Resistance Leve
Monster Harmonic Indicator
Paul Geirnaerdt
4.61 (31)
Monster Harmonics Indicator is a harmonic pattern indicator. It recognizes Gartley, Bat, Crab, Butterfly, Cypher, White Swan, Black Swan, Shark and several other patterns. Projected patterns that are not yet completed are recognized, too. Monster even shows the PRZ (Potential Reversal Zone). Users can add their own user defined patterns to Monster. Besides the current pattern, Monster also shows all patterns in the symbols history. Monster will provide alerts for developing patterns. Introduced
We present you the indicator "Candle closing counter", which will become your indispensable assistant in the world of trading. That’s why knowing when the candle will close can help: If you like to trade using candle patterns, you will know when the candle will be closed. This indicator will allow you to check if a known pattern has formed and if there is a possibility of trading. The indicator will help you to prepare for market opening and market closure. You can set a timer to create a p
Laguerre SuperTrend Clouds adds an Adaptive Laguerre averaging algorithm and alerts to the widely popular SuperTrend indicator. As the name suggests, Laguerre SuperTrend Clouds (LSC) is a trending indicator which works best in trendy (not choppy) markets. The SuperTrend is an extremely popular indicator for intraday and daily trading, and can be used on any timeframe. Incorporating Laguerre's equation to this can facilitate more robust trend detection and smoother filters. The LSC uses the impro
Cosmic Diviner X Planet
Olena Kondratenko
4 (2)
This unique multi-currency strategy simultaneously determines the strength of trends and market entry points, visualizing this using histograms on the chart. The indicator is optimally adapted for trading on the timeframes М5, М15, М30, Н1. For the convenience of users, the indicator renders the entry point (in the form of an arrow), recommended take profit levels (TP1, TP2 with text labels) and the recommended Stop Loss level. The take profit levels (TP1, TP2) are automatically calculated for
Trendiness Index
Libertas LLC
5 (3)
"The trend is your friend" is one of the best known sayings in investing, because capturing large trendy price movements can be extremely profitable. However, trading with the trend is often easier said than done, because many indicators are based on price reversals not trends. These aren't very effective at identifying trendy periods, or predicting whether trends will continue. We developed the Trendiness Index to help address this problem by indicating the strength and direction of price trend
Trade with Gann on your side!! MASTER CIRCLE 360 CIRCLE CHART, originally created by Gann admitted that this is “The Mother of all charts”. It is one of the last studies that this great trader left for us. The numeric tab le is apparently quite simple like all the tables and is based on square numbers, the SQUARE OF 12 and is by evolution, one of the most important square numbers. Here we can find CYCLE, PRICE AND TIME thanks to angles and grades, to show past and future support and resistance.
PV Harmonics
Pierce Vallieres
PV Harmonics - Paints harmonic triangles and patterns on live charts to show current live harmonic patterns. - Paints arrows on charts over the harmonic patterns to signal prime entry and exit points. - Extremely fast and versatile indicator. - Highly accurate. - Non repainting. (Does not repaint entry/exit signals) - Comes with numerous customization settings.
An indicator of patterns #24 and #26 ("Head and Shoulders") from Encyclopedia of Chart Patterns by Thomas N. Bulkowski. Parameters: Alerts - show alert when an arrow appears   Push - send a push notification when an arrow appears (requires configuration in the terminal) PeriodBars - indicator period K - an additional parameter that influences the accuracy of pattern shape recognition ArrowType - a symbol from 1 to 17 ArrowVShift - vertical shift of arrows in points   ShowLevels - show levels Co
Käufer dieses Produkts erwarben auch
Gann Made Easy
Oleg Rodin
4.92 (77)
Gann Made Easy ist ein professionelles und einfach zu bedienendes Forex-Handelssystem, das auf den besten Handelsprinzipien unter Verwendung der Theorie von Mr. basiert. W.D. Gann. Der Indikator liefert genaue KAUF- und VERKAUFSsignale, einschließlich Stop-Loss- und Take-Profit-Levels. Mit PUSH-Benachrichtigungen können Sie auch unterwegs handeln. Bitte kontaktieren Sie mich nach dem Kauf! Ich werde meine Handelstipps und tolle Bonusindikatoren kostenlos mit Ihnen teilen! Wahrscheinlich haben Si
TPSpro RFI Levels
Roman Podpora
4.85 (20)
Reversal First Impulse levels (RFI)    INSTRUCTIONS        RUS       -       ENG              R ecommended to use with an indicator   -   TREND PRO -  Version MT5 A key element in trading is zones or levels from which decisions to buy or sell a trading instrument are made. Despite attempts by major players to conceal their presence in the market, they inevitably leave traces. Our task was to learn how to identify these traces and interpret them correctly. Main functions: Displaying active zones
Atomic Analyst
Issam Kassas
5 (3)
Zunächst einmal ist es erwähnenswert, dass dieser Handelsindikator nicht neu malt, nicht neu zeichnet und keine Verzögerung aufweist, was ihn sowohl für manuellen als auch für Roboterhandel ideal macht. Benutzerhandbuch: Einstellungen, Eingaben und Strategie. Der Atom-Analyst ist ein PA-Preisaktionsindikator, der die Stärke und das Momentum des Preises nutzt, um einen besseren Vorteil auf dem Markt zu finden. Ausgestattet mit fortschrittlichen Filtern, die helfen, Rauschen und falsche Signale z
TPSproTREND PrO
Roman Podpora
4.78 (18)
TPSpro TRENDPRO  - is a trend indicator that automatically analyzes the market and provides information about the trend and each of its changes, as well as giving signals for entering trades without redrawing! The indicator uses each candle, analyzing them separately. referring to different impulses - up or down impulse. Exact entry points into transactions for currencies, crypto, metals, stocks, indices!  -  Version MT5               DETAILED DESCRIPTION                R ecommended to use with
Trend Punch
Mohamed Hassan
5 (14)
Manual guide:   Click here WEEKEND SALE PROMO:   $65 ONLY!  -- Next price is  $120 .  This indicator is unstoppable when combined with our other indicator called  Support & Resistance . After purchase, send us a message and you will get it   for  FREE as a BONUS! I like to use Trend Punch on XAUUSD on the M1 timeframe & higher ones!  Introducing Trend Punch , the revolutionary forex trend indicator that will transform the way you trade! Trend Punch is uniquely designed to provide
Enigmera
Ivan Stefanov
5 (3)
ENIGMERA: Der Kern des Marktes https://www.enigmera.com Einführung Dieser Indikator und dieses Handelssystem sind ein bemerkenswerter Ansatz für die Finanzmärkte. ENIGMERA nutzt die fraktalen Zyklen zur genauen Berechnung von Unterstützungs- und Widerstandsniveaus. Er zeigt die echte Akkumulationsphase an und gibt Richtung und Ziele vor.  Ein System, das funktioniert, egal ob wir uns in einem Trend oder in einer Korrektur befinden.  Wie funktioniert es? ENIGMERA besteht aus drei Linien: der
DERZEIT 26% RABATT Die beste Lösung für jeden Newbie oder Expert Trader! Dieser Indikator ist ein einzigartiges, qualitativ hochwertiges und erschwingliches Trading-Tool, da wir eine Reihe von proprietären Funktionen und eine neue Formel integriert haben. Mit nur EINEM Chart können Sie die Währungsstärke für 28 Forex-Paare ablesen! Stellen Sie sich vor, wie sich Ihr Handel verbessern wird, weil Sie in der Lage sind, den genauen Auslösungspunkt eines neuen Trends oder einer Scalping-Gelegenh
Scalper Inside PRO
Alexey Minkov
4.74 (58)
An exclusive indicator that utilizes an innovative algorithm to swiftly and accurately determine the market trend. The indicator automatically calculates opening, closing, and profit levels, providing detailed trading statistics. With these features, you can choose the most appropriate trading instrument for the current market conditions. Additionally, you can easily integrate your own arrow indicators into Scalper Inside Pro to quickly evaluate their statistics and profitability. Scalper Inside
Werden Sie Breaker Trader und profitieren Sie von Änderungen der Marktstruktur, wenn sich der Preis umkehrt. Der Order Block Breaker Indikator zeigt an, wann sich eine Trend- oder Preisbewegung der Erschöpfung nähert und bereit ist, sich umzukehren. Es weist Sie auf Änderungen in der Marktstruktur hin, die normalerweise auftreten, wenn eine Umkehrung oder ein größerer Rückzug bevorsteht. Der Indikator verwendet eine proprietäre Berechnung, die Ausbrüche und Preisdynamik identifiziert. Jedes
Advanced Supply Demand
Bernhard Schweigert
4.92 (313)
Derzeit 33% Rabatt! Die beste Lösung für jeden Anfänger oder erfahrenen Händler! Dieser Indikator ist ein einzigartiges, qualitativ hochwertiges und erschwingliches Trading-Tool, da wir eine Reihe von proprietären Funktionen und eine neue Formel integriert haben. Mit diesem Update werden Sie in der Lage sein, doppelte Zeitrahmenzonen anzuzeigen. Sie können nicht nur einen höheren TF (Zeitrahmen) anzeigen, sondern sowohl den Chart-TF als auch den höheren TF: SHOWING NESTED ZONES. Alle Supply Dema
Derzeit 20% Rabatt! Die beste Lösung für jeden Neueinsteiger oder Expert Händler! Dieses Dashboard arbeitet mit 28 Währungspaaren. Es basiert auf 2 unserer Hauptindikatoren (Advanced Currency Strength 28 und Advanced Currency Impulse). Es bietet einen hervorragenden Überblick über den gesamten Forex-Markt. Es zeigt die Werte der Advanced Currency Strength, die Veränderungsrate der Währungen und die Signale für 28 Devisenpaare in allen (9) Zeitrahmen. Stellen Sie sich vor, wie sich Ihr Hande
Legacy of Gann
Pavel Zamoshnikov
4.83 (12)
The indicator very accurately determines the levels of the possible end of the trend and profit fixing. The method of determining levels is based on the ideas of W.D.Gann, using an algorithm developed by his follower Kirill Borovsky. Extremely high reliability of reaching levels (according to K. Borovsky  - 80-90%) Indispensable for any trading strategy – every trader needs to determine the exit point from the market! Precisely determines targets on any timeframes and any instruments (forex, met
FX Volume
Daniel Stein
4.6 (35)
Erhalten Sie Ihr tägliches Marktupdate mit Details und Screenshots über unser Morning Briefing hier auf mql5 und auf Telegram ! FX Volume ist der ERSTE und EINZIGE Volumenindikator, der einen ECHTEN Einblick in die Marktstimmung aus Sicht eines Brokers bietet. Es bietet fantastische Einblicke in die Positionierung von institutionellen Marktteilnehmern, wie z.B. Brokern, auf dem Forex-Markt, viel schneller als COT-Berichte. Diese Informationen direkt auf Ihrem Chart zu sehen, ist der wahre Game
FX Power MT4 NG
Daniel Stein
5 (11)
Erhalten Sie Ihr tägliches Marktupdate mit Details und Screenshots über unser Morning Briefing hier auf mql5 und auf Telegram ! FX Power MT4 NG ist die nächste Generation unseres langjährig sehr beliebten Währungsstärkemessers FX Power. Und was bietet dieser Stärkezähler der nächsten Generation? Alles, was Sie am ursprünglichen FX Power geliebt haben PLUS GOLD/XAU-Stärkeanalyse Noch präzisere Berechnungsergebnisse Individuell konfigurierbare Analysezeiträume Anpassbares Berechnungslimit für noc
Zunächst einmal ist es wichtig zu betonen, dass dieses Handelstool ein Nicht-Repaint-, Nicht-Redraw- und Nicht-Verzögerungsindikator ist, was es ideal für professionelles Trading macht. Online-Kurs, Benutzerhandbuch und Demo. Der Smart Price Action Concepts Indikator ist ein sehr leistungsstarkes Werkzeug sowohl für neue als auch erfahrene Händler. Er vereint mehr als 20 nützliche Indikatoren in einem und kombiniert fortgeschrittene Handelsideen wie die Analyse des Inner Circle Traders und Stra
Trend Screener
STE S.S.COMPANY
4.83 (88)
Trendindikator, bahnbrechende, einzigartige Lösung für Trendhandel und -filterung mit allen wichtigen Trendfunktionen in einem Tool! Es handelt sich um einen 100 % nicht neu zu malenden Multi-Timeframe- und Multi-Währungs-Indikator, der für alle Symbole/Instrumente verwendet werden kann: Forex, Rohstoffe, Kryptowährungen, Indizes und Aktien. Trend Screener ist ein effizienter Trendfolgeindikator, der Pfeiltrendsignale mit Punkten im Diagramm liefert. Die Funktionen, die im Trendanalysator-Indika
M1 Arrow
Oleg Rodin
5 (14)
Eine Intraday-Strategie, die auf zwei Grundprinzipien des Marktes basiert. Der Algorithmus basiert auf der Analyse von Volumina und Preiswellen mit zusätzlichen Filtern. Der intelligente Algorithmus des Indikators gibt nur dann ein Signal, wenn sich zwei Marktfaktoren zu einem vereinen. Der Indikator berechnet Wellen eines bestimmten Bereichs auf dem M1-Diagramm unter Verwendung der Daten des höheren Zeitrahmens. Und um die Welle zu bestätigen, verwendet der Indikator eine Volumenanalyse. Dieser
TrendMaestro
Stefano Frisetti
5 (3)
note: this indicator is for METATRADER4, if you want the version for METATRADER5 this is the link:  https://www.mql5.com/it/market/product/108106 TRENDMAESTRO ver 2.4 TRENDMAESTRO recognizes a new TREND in the bud, he never makes mistakes. The certainty of identifying a new TREND is priceless. DESCRIPTION TRENDMAESTRO identifies a new TREND in the bud, this indicator examines the volatility, volumes and momentum to identify the moment in which there is an explosion of one or more of these data a
GOLD Impulse with Alert
Bernhard Schweigert
4.56 (9)
Dieser Indikator ist eine hervorragende Kombination aus unseren 2 Produkten Advanced Currency IMPULSE with ALERT  +   Currency Strength Exotics . Es funktioniert für alle Zeitrahmen und zeigt grafisch Impulse der Stärke oder Schwäche für die 8 wichtigsten Währungen plus ein Symbol! Dieser Indikator ist darauf spezialisiert, die Beschleunigung der Währungsstärke für beliebige Symbole wie Gold, Exotische Paare, Rohstoffe, Indizes oder Futures anzuzeigen. Als erster seiner Art kann jedes Sym
TakePropips Donchian Trend Pro
Eric John Pajarillaga Aldana
4.82 (17)
TakePropips Donchian Trend Pro   (MT4) ist ein leistungsstarkes und effektives Tool, das mithilfe des Donchian-Kanals automatisch die Richtung des Trends erkennt und Ihnen Handelssignale für den Ein- und Ausstieg liefert! Dieser Multifunktionsindikator umfasst einen Trendscanner, Handelssignale, ein statistisches Panel, einen Screener, Handelssitzungen und ein Dashboard für den Verlauf von Warnungen. Es wurde entwickelt, um Ihnen Handelssignale zu liefern und Ihnen Stunden beim Analysieren der C
Entdecken Sie das Geheimnis des erfolgreichen Forex -Handels mit unserem benutzerdefinierten MT4 -Indikator! Haben Sie sich jemals gefragt, wie Sie Erfolg auf dem Forex -Markt erzielen können und gleichzeitig Gewinne erzielen und gleichzeitig das Risiko minimieren können? Hier ist die Antwort, nach der Sie gesucht haben! Erlauben Sie uns, unseren proprietären MT4 -Indikator vorzustellen, der Ihren Handelsansatz revolutionieren wird. Einzigartige Vielseitigkeit Unser Indikator ist speziell
PRO Renko System ist ein hochpräzises Handelssystem, das speziell für den Handel mit RENKO-Charts entwickelt wurde. Dies ist ein universelles System, das auf verschiedene Handelsinstrumente angewendet werden kann. Das System neutralisiert effektiv so genannte Marktgeräusche, die Ihnen Zugang zu genauen Umkehrsignalen geben. Der Indikator ist sehr einfach zu bedienen und hat nur einen Parameter, der für die Signalerzeugung verantwortlich ist. Sie können das Tool einfach an jedes Handelsinstr
DERZEIT 31% RABATT! Die beste Lösung für jeden Newbie oder Expert Trader! Dieser Indikator ist ein einzigartiges, qualitativ hochwertiges und erschwingliches Handelsinstrument, da wir eine Reihe von proprietären Funktionen und eine geheime Formel eingebaut haben. Mit nur EINEM Chart liefert er Alerts für alle 28 Währungspaare. Stellen Sie sich vor, wie sich Ihr Handel verbessern wird, weil Sie in der Lage sind, den genauen Auslösepunkt eines neuen Trends oder einer Scalping-Gelegenheit zu e
Wir stellen vor       Quantum Trend Sniper Indicator   , der bahnbrechende MQL5-Indikator, der die Art und Weise, wie Sie Trendumkehrungen erkennen und handeln, verändert! Entwickelt von einem Team erfahrener Händler mit über 13 Jahren Handelserfahrung,       Quantum Trend Sniper-Indikator       wurde entwickelt, um Ihre Trading-Reise mit seiner innovativen Methode zur Identifizierung von Trendumkehrungen mit extrem hoher Genauigkeit auf ein neues Niveau zu heben. ***Kaufe Quantum Trend Snipe
Natürlich, hier ist die Übersetzung in Deutsch: Vorstellung des Astronomie-Indikators für MT4: Dein ultimativer himmlischer Trading-Begleiter Bist du bereit, deine Trading-Erfahrung auf himmlische Höhen zu heben? Suche nicht weiter als unseren revolutionären Astronomie-Indikator für MT4. Dieses innovative Tool übertrifft herkömmliche Trading-Indikatoren und nutzt komplexe Algorithmen, um dir unvergleichliche astronomische Einblicke und präzise Berechnungen zu bieten. Ein Universum an Information
Currency Strength Exotics
Bernhard Schweigert
4.88 (33)
Stärke von 8 Währungen plus EIN EXOTISCHES Paar oder Rohstoffe oder Indexe! Jedes Produkt kann als 9. Linie hinzugefügt werden. Fügen Sie Rohstoffe, Indexes oder exotische Währungen hinzu (Gold, Silber, Öl, DAX, US30, MXN, TRY, CNH ...). Eine neue noch nie dagewesene TRADING STRATEGIE  !!! Dieser Indikator ist einzigartig, weil wir eine Reihe von proprietäre Funktionen und neue Formeln eingebaut haben. Es funktioniert für alle Zeitrahmen. Basierend auf neuen zugrunde liegenden Algorithmen ist
Currency Strength Wizard ist ein sehr leistungsstarker Indikator, der Ihnen eine Komplettlösung für erfolgreichen Handel bietet. Der Indikator berechnet die Stärke dieses oder jenes Forex-Paares anhand der Daten aller Währungen in mehreren Zeitrahmen. Diese Daten werden in Form von benutzerfreundlichen Währungsindizes und Währungsstärkelinien dargestellt, anhand derer Sie die Stärke dieser oder jener Währung erkennen können. Sie müssen lediglich den Indikator an das Diagramm anhängen, mit dem Si
ICT, SMC, SMART MONEY CONCEPTS, SMART MONEY, Smart Money Concept, Support and Resistance, Trend Analysis, Price Action, Market Structure, Order Blocks, BOS/CHoCH,   Breaker Blocks ,  Momentum Shift,   Supply&Demand Zone/Order Blocks , Strong Imbalance, HH/LL/HL/LH,    Fair Value Gap, FVG,  Premium  &   Discount   Zones, Fibonacci Retracement, OTE, Buy Side Liquidity, Sell Side Liquidity, BSL/SSL Taken, Equal Highs & Lows, MTF Dashboard, Multiple Time Frame, BigBar, HTF OB, HTF Market Structure, 
ECM Channel MT4
Paulo Rocha
5 (1)
ECM Elite Channel is a volatility-based indicator, developed with a specific time algorithm, which consists of finding possible corrections in the market. This indicator shows two outer lines, an inner line (retracement line) and an arrow sign, where the channel theory is to help identify overbought and oversold conditions in the market. The market price will generally fall between the boundaries of the channel. If prices touch or move outside the channel, it's a trading opportunity. The
Indicator : RealValueIndicator Description : RealValueIndicator is a powerful tool designed specifically for trading on the EURUSD pair. This indicator analyzes all EUR and USD pairs, calculates their real currency strength values, and displays them as a single realistic value to give you a head start on price. This indicator will tell you moves before they happen if you use it right. RealValueIndicator allows you to get a quick and accurate overview of the EURUSD currency pair tops and bottoms,
Weitere Produkte dieses Autors
Colored candles
Alexander Nikolaev
Einige Kerzen neigen stark dazu, die Bewegung oder ihre Drehung fortzusetzen. Mit dem ColoredCandles-Indikator sind solche Kerzen deutlich sichtbar. Dieser Indikator berechnet die Parameter jeder Kerze sowie ihr Volumen und färbt danach die Kerzen je nach Stärke und Richtung. Bullische Kerzen werden grün und bärische Kerzen werden rot. Je stärker die Bullen oder Bären sind, desto heller ist die Farbe. Falls gewünscht, können die Farben geändert werden. Der Indikator funktioniert für jedes Wäh
This utility is the improved version of Trailing stop for advisors. It manages other EAs' orders as well as the ones opened manually. It is capable of trailing the price (trailing stop function), set a stop loss and take profit if they have not been set before. The Pro version features the ability to set trailing stop based on fractals and points of Parabolic SAR. When configuring the utility for an EA having no trailing stop function, place it to the new window with the same currency pair speci
Double Tops And Bottoms MT5
Alexander Nikolaev
4.86 (7)
Dieser Indikator findet und zeigt die technischen Analysemuster Double Bottom und Double Top an. Signalisiert (zeigt eine Meldung auf dem Bildschirm an), wenn die Form vor kurzem geformt wurde. Nach dem Auftreten dieser Muster kehrt sich der Trend oft um oder es kommt zu einer Korrektur. Um nicht selbst nach ihnen zu suchen oder ihr Aussehen nicht zu verpassen, reicht es aus, dem Diagramm einen Indikator hinzuzufügen. Der Indikator kann für verschiedene Zeitrahmen und Währungspaare verwendet we
FREE
Easy Channels MT5
Alexander Nikolaev
5 (1)
Dieser Indikator zeichnet Preiskanäle. Einfach zu verwenden. Es hat verschiedene Einstellungen, zum Beispiel können Sie es so konfigurieren, dass Kanäle nur zum Kaufen oder Verkaufen angezeigt werden. Sie können Trendlinien anstelle von Kanälen anzeigen. Es gibt viele Handelsstrategien, die auf dem Handel mit Kanälen basieren. Sie können beim Rebound von den Grenzen der Kanäle oder beim Zusammenbruch des Kanals handeln.   Parameter Verlauf - die maximale Anzahl von Balken zum Erstellen von Kanä
ADX Channel Indicator
Alexander Nikolaev
4.8 (5)
Dieser Indikator bildet einen Kanal basierend auf den Messwerten des ADX-Indikators (Average Directional Movement Index), zeigt den Händler an und informiert ihn über eine Preisumkehr an den Grenzen dieses Kanals. Er kann auch melden, wenn der Preis die Kanalgrenzen berührt. Außerdem werden zusätzliche gepunktete Linien gezeichnet, die von den + DI- und -DI-Werten des ADX-Indikators abhängen. Es besteht auch die Möglichkeit, Signale in Abhängigkeit von den stochastischen Messwerten zu filtern.
FREE
Doji Finder Indicator MT5
Alexander Nikolaev
3.33 (3)
Der Indikator analysiert das Diagramm und identifiziert Doji-Kerzenhalter. Zeigt ihr Aussehen und signalisiert das Aussehen einer solchen Kerze (falls in den Parametern erlaubt). Dieser Indikator zeigt auch die Stärke der Umkehrung in Form von Balken unterschiedlicher Farben (je grüner, desto wahrscheinlicher ein Anstieg, desto roter, ein Preisverfall). Die Richtung des Signals hängt von der Richtung der vorherigen Kerzen ab, da der Doji eine Umkehrung oder Korrektur signalisiert. In den Anzeig
FREE
Easy Bollinger Bands
Alexander Nikolaev
3.88 (8)
This Expert Advisor trades based on the Bollinger Bands indicator. It performs trades after a price rebound from the borderlines of the indicator. It is simple to use, contains only a few settings, which are easy to understand. This is the simplified version of the Master Bollinger Bands Expert Advisor. For better trading results, it is recommended to use the full version of the EA: https://www.mql5.com/en/market/product/21788 The free version does not provide the ability to use multiple indicat
FREE
Kostenloser Indikator zur schnellen Erkennung von Trendlinienausbrüchen und hohen oder niedrigen Preisspannen. Es zeigt Linien basierend auf den Hochs und Tiefs der Preise an und findet und zeigt geneigte Trendlinien an. Sobald der Preis über die Linie hinausgeht und der Kerzenhalter schließt, signalisiert der Indikator dies mit einem Pfeil (Sie können auch eine Warnung aktivieren). Dieser Indikator ist einfach zu bedienen und auch kostenlos. Die Anzahl der Kerzen zur Definition von Trendlinien
FREE
Easy Channels
Alexander Nikolaev
4 (5)
The indicator draws price channels. It can be customized so that only buy or sell channels are displayed. Also, trend lines can be displayed instead of channels. This indicator is easy to use, but nevertheless, there are many trading strategies based on channel trading. Advisor based on this indicator:  https://www.mql5.com/en/market/product/37952 Parameters History - maximum number of bars to build channels; Distance - minimum distance from one High (or Low) to another when constructing a chann
FREE
ADX Channel
Alexander Nikolaev
4.83 (6)
ADX Channel is an indicator that plots the channel depending on the values of the ADX (Average Directional Movement Index) indicator. The resulting channel is a little similar to the Envelopes, but its lines depend on the market volatility. The sell trade is usually executed fast when the price touches and bounces from the upper line of the channel, buy - from the lower. It is recommended to trade when there is no significant news. The recommended timeframes: M5 - H1. The indicator is not design
FREE
Trend and correction indicator
Alexander Nikolaev
4.11 (9)
The indicator finds strong trend movements of a currency pair over the specified number of bars. It also finds correction to this trend. When the trend is strong enough, and the correction becomes equal to the values specified in the parameters, the indicator generates a signal. You can set different correction values, while the best suiting are 38, 50 and 62 (Fibonacci levels). In addition, you can configure the minimum length of trend, the number of history bars for search and other parameters
FREE
Break Lines
Alexander Nikolaev
4.8 (5)
The indicator draws lines the the price highs and lows. Break through the high or low usually indicates trend change (or continuation). Once the price moves through a line, and the candlestick closes, the indicator draws an appropriate arrow (also, you can enable alerts). A deal should be conducted in the breakthrough direction immediately or after a slight rollback. It is best to trade following the trend on a larger timeframe. This indicator is easy to use, but nevertheless, there are many tra
FREE
Easy Parabolic Sar
Alexander Nikolaev
4.22 (9)
Der EA platziert Orders an den Punkten des parabolischen Sar-Indikators. Wenn Ihre Handelsstrategie mit diesem Indikator verbunden ist, müssen Sie nicht mehr jede Kerze (sei es 5 Minuten oder 1 Stunde) Pending Orders verschieben - der Berater wird es selbst tun. Kann so konfiguriert werden, dass bei Bedarf nur BuyStop-Orders oder nur SellStop geöffnet werden. Standardmäßig werden ausstehende Aufträge sowohl für den Kauf als auch für den Verkauf platziert. Außer dem Parapolic Sar Indikator verwe
FREE
This EA trades with the trend using several methods to identify and enter a trade. For example, it uses trendlines, Gator and Stochastic indicators to analyze the market. In addition to trading, it can also display trend lines that it trades based on. It has filters for ADX and MA indicators, as well as a sufficient number of settings to be able to optimize on various currency pairs and timeframes. The EA sets stop loss and take profit for each trade, does not have risky trading methods. It i
Simple Trade MT5
Alexander Nikolaev
Dieser EA ist einfach zu bedienen und verfügt nicht über zu komplizierte Einstellungen und Algorithmen für die Durchführung von Handelsoperationen. Es ist nicht lange optimiert, es kann diejenigen ansprechen, die sich kürzlich entschlossen haben, mit Hilfe von Beratern an der Börse zu handeln, oder die die Einstellungen für lange Zeit nicht verstehen wollen. Grundlage seiner Arbeit sind mehrere Indikatoren (gleitender Durchschnitt, RSI, stochastisch, ATR). Trotz seiner Einfachheit verfügt es übe
Three Fractals demo
Alexander Nikolaev
2 (1)
This Expert Advisor identifies trend reversals based on fractals and some other indicators. It is a free lite version of Three fractals Brief description of the trading strategy: when the fractals were formed after a prolonged fall, and the last fractal did not update the minimum of the previous bar's lower fractal, then a trend reversal is determined (at the same time, there must be a fractal in the middle, which is higher than the others). Similarly, opposite for growth. In case other indicato
FREE
Dieser Indikator kann das Preisniveau bestimmen, bei dem im angegebenen Zeitraum das größte Volumen vorhanden war. In Zukunft springt der Preis häufig von solchen Niveaus ab, und dies kann erfolgreich im Handel angewendet werden. Sie werden als Linien angezeigt, einige Parameter zur Bestimmung der Pegel können angepasst werden. Dieser Indikator ist eine kostenlose Version von Volume Levels MT5 , daher werden keine Signale gemeldet, und die Erstellung von Pegeln ist auf ein Währungspaar EUR / USD
FREE
Night Envelopes
Alexander Nikolaev
1 (1)
This trading adviser is designed for trading during a low volatility, when the majority of the population sleeps or rests. You can set up any trading hours (for example, from 23 pm to 9 am) and the closing hour of all open trades. Can make no more than 2 transactions in one direction, so that it is not critical for the deposit. To open trades uses the lines of the indicator Envelopes. When testing and trading on the standard settings, be sure to optimize the trading time and transaction closin
Easy Candles
Alexander Nikolaev
3.25 (4)
This is a simple and free Expert Advisor that trades candlesticks. It compares several nearest bars and their volumes, and opens a trade based on that data. Unlike the professional version , it analyzes only 1 timeframe. The recommended timeframes for this EA are H1, H4, D1, it works with any currency pairs. The parameters always need to be optimized before trading, as well as after some period of trading. Input Parameters Lots - lot size (if Lots=0, then the lot will be calculated based on th
FREE
Volume Levels USDJPY
Alexander Nikolaev
3.5 (4)
Volume Levels is a very important indicator for exchange trading. Most of the trades were performed on those levels. This indicator displays the price level that had the most trade volumes over a certain period of time. Often, the price bounces from those levels in the future, and it can be successfully used in trading. This is a demo version that works only on the USD/JPY currency pair. To work on all currency pairs, install the full version: https://www.mql5.com/en/market/product/15888 Param
FREE
Trailing stop for advisors
Alexander Nikolaev
4 (4)
The utility manages other EAs' orders as well as the ones opened manually. It is capable of trailing the price (trailing stop function), set a stop loss and take profit if they have not been set before. When configuring the utility for an EA having no trailing stop function, place it to the new window with the same currency pair specifying the same Magic value (as for the EA orders the stop loss is to be applied to). You can set any timeframe. It does not affect the utility operation. Set Magic
FREE
Bollinger with WPR demo
Alexander Nikolaev
3.75 (4)
Dieser Expert Advisor ist eine kostenlose Version von Bollinger mit WPR-Scalper und handelt basierend auf Bollinger-Bändern und den Percent Range-Indikatoren von Williams. Einschränkungen der kostenlosen Version - Fixed Lot = 0,01, funktioniert nur mit dem Währungspaar EURUSD, Sie können die Handelszeit nicht wählen, es gibt keinen Trailing-Stop. Trotzdem kann es viele Geschäfte machen, so dass Sie nicht lange auf Eröffnungspositionen warten müssen (mit entsprechenden Einstellungen und Zeitrahm
FREE
EMA 8 and 18 Trading System
Alexander Nikolaev
2 (1)
This EA implements the EMA 8/18 strategy, which is used by many traders. Brief description of the strategy: The Buy is determined when the EMA 8 indicator crosses the EMA 18 from below, with the price moving more than 50 points from the crossing. The buy position is opened when the price touches the EMA for the first time, after that, as the price rises, the trade is maintained by a trailing stop with a step of 30-35 points. The opposite is for opening a sell position. The parameters of the fast
Colored Candles Demo
Alexander Nikolaev
5 (1)
The demo version of the Colored Candles indicator - calculates the parameters of each candle, as well as its volume. After that, it paints the candles depending on their strength and direction. Bullish candles are colored green and bearish candles - red. The greater the power of the bulls or the bears, the brighter the color. You can change the colors if you want. The indicator helps to analyze the price movement, as well as market entry points. The more accurate signals are formed on the higher
FREE
Volume Candles
Alexander Nikolaev
Volumes are one of the most important factors of trading, as it is the high volumes that move the market in either direction. But there are very few standard indicators for volumes in MetaTrader 4. The Volume Candles analyses the volumes of the trades and displays candles depending on these volumes. The candle appears once the required number of volumes has passed during trading (the VolumeCandle parameter). If the candles close frequently and are thin, then the volumes on the market are current
Volume Levels
Alexander Nikolaev
5 (3)
Volume Levels is a very important indicator for exchange trading. Most of the trades were performed on those levels. This indicator displays the price level that had the most trade volumes over a certain period of time. Often, the price bounces from those levels in the future, and it can be successfully used in trading. It works on any currency pair. Parameters HistoryBars - the number of bars to determine the near volume levels; Range - the maximum distance above and below the current price t
ProCandles
Alexander Nikolaev
Some experienced trades can tell where the price will go even without indicators, as the direction of the price can be found using the ordinary candlesticks. The EA compares several nearest bars and their volumes, and opens a trade based on that data. Also, it is able to analyze the candles on two timeframes at the same time to make the entry more accurate and less risky. In addition, the EA can automatically determine the take profit and stop loss size depending on the size of the previous cand
It is good to know the presence of a trend on multiple timeframes at once. And even better - on multiple currency pairs at once. This indicator allows to quickly determine the presence of a trend or a flat on 8 timeframes and from 1 to 15 currency pairs at once. Multi Alligator Signals analyzes the signals of the Alligator indicator by Bill Williams on every timeframe (from M1 to W1) and multiple currency pairs (up to 15) simultaneously. If there is a buy signal, a green upward arrow is drawn, i
Parabolic And CCI
Alexander Nikolaev
5 (1)
The EA detects strong movements using the Parabolic indicator and opens a trade. The Commodity Channel Index (CCI) is used as an auxiliary indicator. The CCI levels may depend on the ADX indicator values, which allows for better trading with different volatility. Also, the trades are opened depending on the RSI indicator values on a certain timeframe. Recommended timeframes: M5, M15, M30. Make sure to optimize the parameters of the EA for your account before trading. Input Parameters Lots - lo
Breakout Trend Lines
Alexander Nikolaev
5 (2)
Ein Indikator, der Linien basierend auf Preishochs und -tiefs sowie abfallenden Trendlinien zeichnet. Ein Ausbruch einer Trendlinie, hoch oder niedrig, signalisiert normalerweise eine Änderung (oder Fortsetzung) des Trends. Sobald der Preis über die Linie hinausgeht und der Kerzenhalter schließt, signalisiert die Anzeige dies mit einem Pfeil (Sie können auch den Alarm einschalten). Dieser Indikator ist sehr einfach zu verwenden, es gibt jedoch viele Handelsstrategien, die auf Trendlinienausbrüc
Auswahl:
Keine Bewertungen
Antwort auf eine Rezension
Version 1.3 2021.09.29
Improved drawing of 2nd bottom and 2nd top.
Version 1.2 2021.09.09
Verbesserung der Suche nach Kopf-Schulter-Mustern