TIL Timeframe Overlay
- Indikatoren
- Viktor Macariola
- Version: 1.1
- Aktualisiert: 21 November 2021
- Aktivierungen: 20
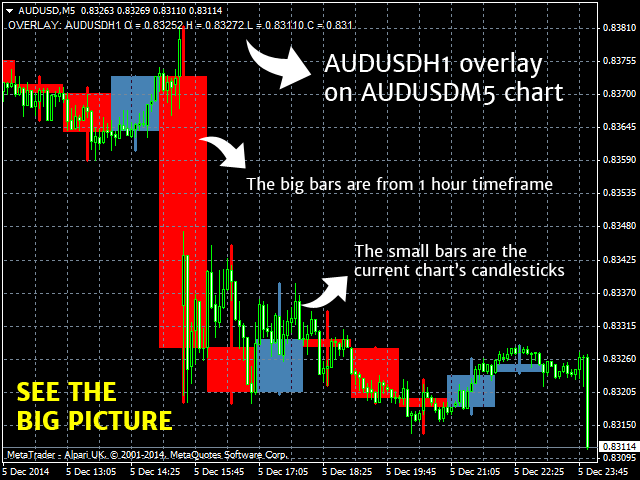
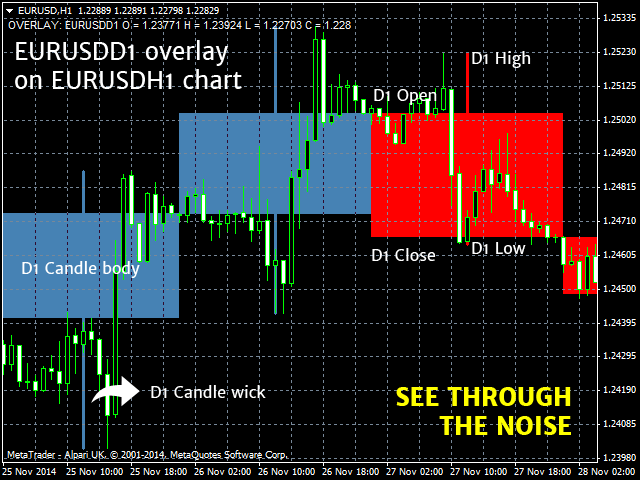
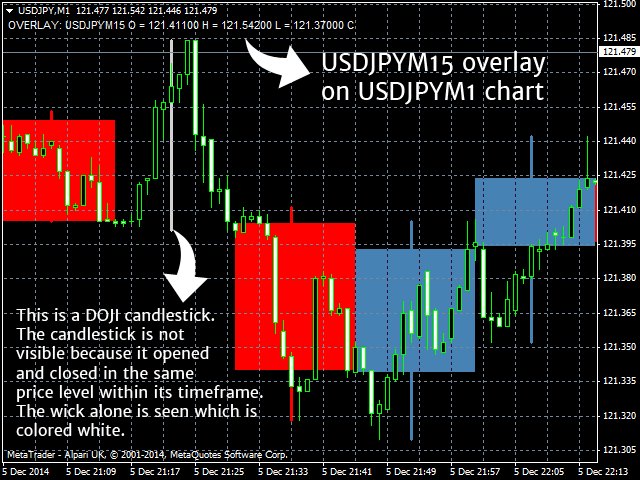
The TIL Timeframe Overlay indicator is the perfect tool for multiple timeframe analysis. It does the simple yet powerful task of overlaying a candlestick chart of a different timeframe over another allowing you to see the BIGGER picture and see the underlying TREND amid the noise and volatile price action. Please see the screenshots below for examples.
Features:
- It works in ALL timeframe.
- It works in ANY instrument/symbol.
- Displays ENTIRE candlesticks (body and wick) of other timeframes including OPEN, HIGH, LOW, and CLOSE prices.
- You can choose ANY timeframe to overlay.
- Of course, the indicator does not repaint. It displays a new candlestick as new ones close (in real time) depending on the chosen timeframe.
- The colors of the candlesticks can be customized.
A few notes:
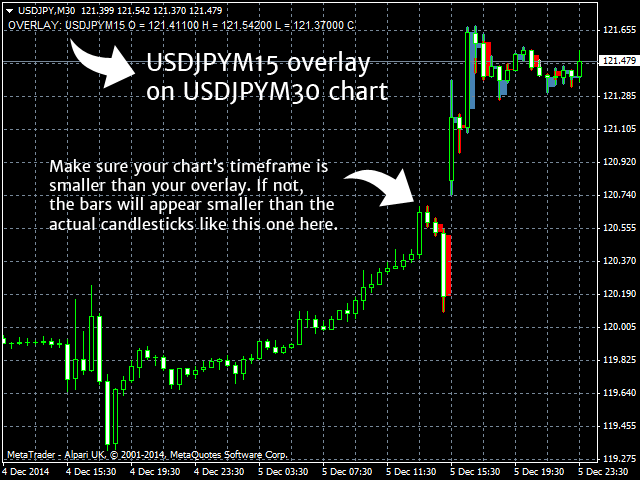
- Please make sure that the timeframe you choose to overlay is LARGER than the chart you are attaching it to.
- Due to the limitations of MQL objects, you can only properly use one instance of this indicator at a time.
- The indicator displays candlesticks only when it is closed.

